
- Solana recaptured vital moving averages and traded up to the $81 area on the 100 day EMA following recovery.
- Weekly network activity was at an all-time high due to increased active users and non-voting transactions.
- Volume went higher while open interest remained unchanged suggesting that traders repositioned positions rather than adding leverage.
Solana price was back in the spotlight again on July 7, as SOL traded below an important level of support after a week of high network activity.
The cryptocoin was trading at $81.49, showing a decline of 0.49% from the price in the previous 24 hours. With the latest price action coming after Solana’s recovery from a recent low of $60.29, SOL managed to cross some technical support levels, which had served as resistance in the past.
Additionally, according to on-chain statistics, Solana was seeing a new weekly high in terms of non-vote transactions and active users, whereas in the derivatives market, higher volumes were being seen without any increase in leverage positions.
Solana Price Forecast Suggests Crucial Technical Challenge for SOL
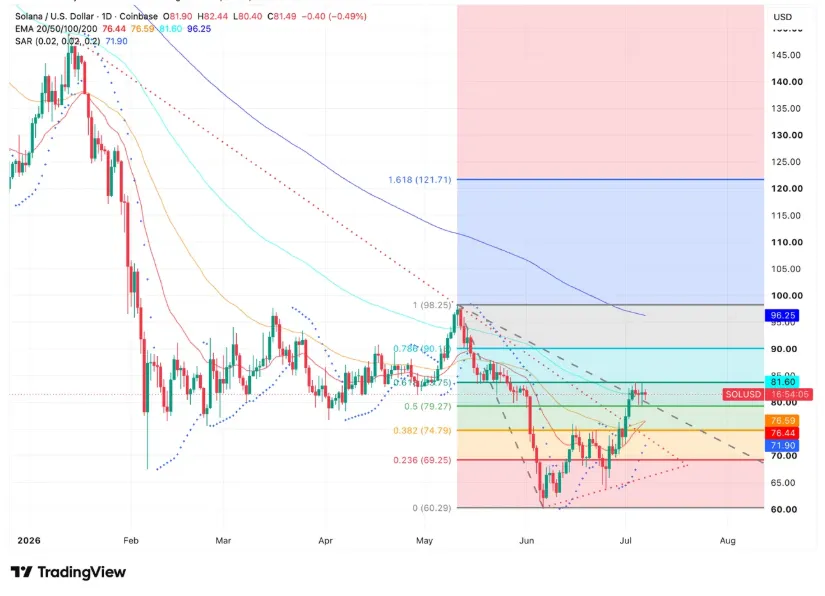
The daily chart revealed SOL approaching the 100-day moving average of $81.60 right from the start, thus becoming one of the major resistance levels under consideration within the current recovery phase. Moreover, it was the first significant attempt of the cryptocurrency to return to the indicator following its downfall in June.
Having bounced off $60.29, Solana climbed through the series of Fibonacci retracement levels. Having managed to breach the 0.5 retracement at $79.27, the focus shifted towards the 0.618 retracement at $83.75.
At the same time, the 20-day EMA at $76.44 and 50-day EMA at $76.59 stayed below the current market price, having been recovered in July’s rally. It was the first time since May when the SOL traded above both short-term moving averages.
Source: Trading View
The Parabolic SAR, located at $71.90, also stayed below the market price, showing that the short-term rally pattern is intact.
Further above the current trading range, additional resistance levels were observed near the 0.786 Fibonacci retracement level at $90.18 and 200-day EMA at $96.25.
Technical Levels of Importance
| Level | Description |
| $79.27 | 0.5 Fibonacci retracement support |
| $76.44 | 20-day EMA support |
| $83.75 | 0.618 Fibonacci resistance |
| $90.18 | 0.786 Fibonacci resistance |
| $96.25 | 200-day EMA resistance |
Higher Trading Volume with Stable Open Interest
The data provided indicates that there was an increase in the level of trading volumes in the last 24 hours.
Intraday trading volumes increased by 45.57% to $9.42 billion. At the same time, open interest fell by 0.34% to $5.53 billion.
Option markets also experienced an increase in their number of participants. The options trade turnover was up 47.60% to $18.27 million due to an increase in the number of participants who used derivatives and the spot market together.
There was a relatively equal distribution of positions held by bulls and bears.
In the reporting period:
- Short liquidations amounted to $10.06 million
- Long liquidations amounted to $9.85 million
Solana Network Activity Reaches New Weekly High
As the price kept testing resistance levels technically, activity on the blockchain network hit new all-time highs.
Data from SolanaFloor showed that the Solana network saw more than one billion non-vote transactions carried out in a single week for the very first time. This means that more than one billion non-vote transactions were conducted on the network within one week.
Moreover, the level of user participation also witnessed a significant rise over a short time frame. The weekly active users grew from 16.8 million to 29.7 million within just two weeks, which accounted for 12.9 million more wallets or a 76.8% growth over the period.
The level of activity on exchanges was also high. Solana emerged second in terms of combined volume of centralized and decentralized spot trading at $12.25 billion for the second week running. That total exceeded Bybit’s $10.57 billion, while only Binance recorded a higher volume during the same period.
Solana Price Prediction Draws Attention After Analyst’s Market Outlook
The improving network metrics coincided with comments from crypto analyst Ansem, who stated that Solana had already established its cycle bottom.
Speaking on the Market Bubble podcast alongside FaZe Banks, Ansem said his assessment was based on observing multiple cryptocurrency market cycles since entering the market in 2017.
Solana’s tendency to recover after negative sentiment periods has been highlighted by Ansem, citing the recovery that happened after the FTX collapse.
Ansem also pointed out similarities between current market dynamics and those from the past, saying that Bitcoin is trading about 50% below its all-time high while Solana is around 75 percent below its all-time high after several months of consolidation.
Ansem said several of Solana’s underlying fundamentals were improving despite the extended consolidation in price.
Momentum is something that could change very rapidly should the market conditions remain favorable.
Speaking about valuation, Ansem noted that $600 is a probable target for the current market cycle. Furthermore, he mentioned that reaching a market cap that can match the peak market cap of Ethereum of about $600 billion would equate to about $990 for each SOL, but he emphasized that $600 is the feasible target at the current market cycle.
In addition to all of these, Ansem emphasized that infrastructure development on the Solana platform is still taking place in order to facilitate ecosystem expansion through market cycles. He also said future expansion could include projects beyond the memecoin sector as development activity continues.
Outlook Centers on Resistance Levels
The current Solana Price Prediction remains closely tied to the technical levels immediately above the market.
SOL has recovered above its 20-day and 50-day EMAs while moving beyond the 0.5 Fibonacci retracement. Nevertheless, the 100-day EMA of $81.60 remains the primary resistance point, followed by the $83.75, $90.18 and 200-day EMA of $96.25.
Frequently Asked Questions (FAQs)
What is the Solana price now?
Solana price was trading at $81.49 as of July 7th, down by 0.49% from the last 24 hours.
What are the Solana supports?
Important support points for SOL are $79.27, matching the 0.50 Fibonacci retracement and $76.44, where the 20-day EMA resides.
What are the Solana resistances?
Important resistance levels for SOL are the 100-day EMA at $81.60 and the 0.618 Fibonacci retracement at $83.75. Other resistance levels are $90.18 at the 0.786 Fibonacci retracement and the 200-day EMA at $96.25.