

- Litecoin trades above the 20-day EMA, though the resistance level at $45.99 remains strong and keeps dampening the rebound potential.
- The open interest fell to $324.8 million, and the exchange outflow continues to support the long-term trend.
- Bouncing above $47.60 will be positive for the bounce move, while falling below $43.99 may put renewed pressure on
Litecoin Price remains under the spotlight even as Litecoin finds a footing after its bounce back from a recent swing low to move to a short-term technical support zone despite the presence of resistance in the broader market conditions.
The cryptocurrency bounced back from its decline, but it is currently trading above the 20-day exponential moving average, an indication that there has been increased buying pressure on the short term.
Nevertheless, the cryptocurrency is trading below the 50-day exponential moving average, making it unable to confirm any market trend using derivatives position and momentum indicators.
As of writing, Litecoin was trading at about $44.90, registering a decline of 1.92% over the last 24 hours after having retreated from above $45.80 during the intraday session. Trading volume rose by 34.59% over the last 24 hours.
Litecoin Price Prediction Indicates Recovery Beyond Temporary Support
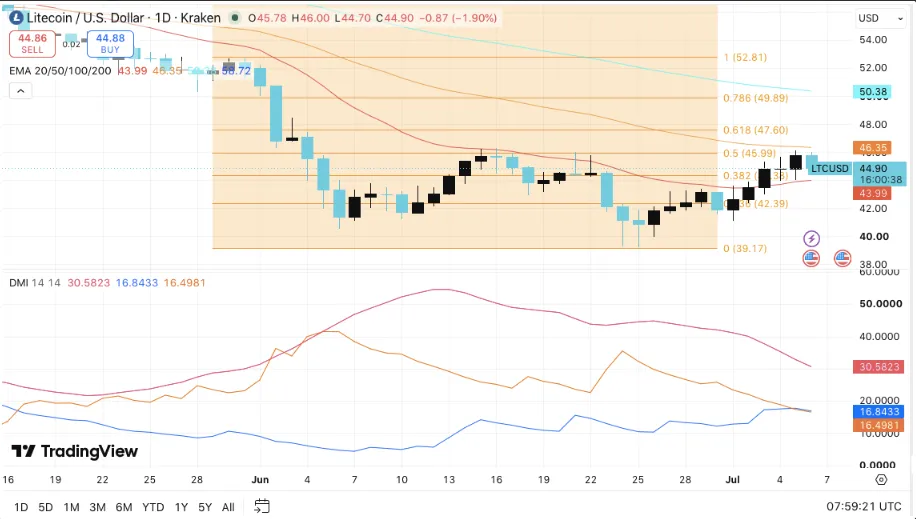
Litecoin has bounced back from the recent low of $39.17, thus enabling the cryptocurrency to rise beyond the 20-day EMA support of $43.99. Breaking above this level ensures that the short-term trend is once again on solid ground after several weeks of weakness.
Source: Trading View
Even though this is the case, Litecoin is still trading below the 50-day EMA, which stands at $46.35. For as long as this level is not broken, the overall corrective trend will continue to hold, since there are multiple resistance levels.
The most recent trend indicates that the buyers are holding their ground by successfully defending the swing low, though the technical barriers are still restraining the upward progress.
Resistance Levels Dictate the Future Move
The immediate technical target is still the level of $45.99 and it is the first resistance level. Breaking it out would lead to the next technical target, which is represented by the Fibonacci retracement of 0.5 at $47.60.
Following that, there would be another technical obstacle that stands at $49.89, being the Fibonacci retracement level of 0.618.
However, one more significant technical barrier would be at the level of $50.38, where there is the 100-day moving average line. Overcoming it would indicate that the next technical target would be the Fibonacci retracement level of $52.81.
Important Resistance Levels
| Resistance Level | Technical Indicator |
| $45.99 | 0.382 Fibonacci Retracement |
| $46.35 | 50-day EMA |
| $47.60 | 0.5 Fibonacci Retracement |
| $49.89 | 0.618 Fibonacci Retracement |
| $50.38 | 100-day EMA |
| $52.81 | Full Fibonacci Retracement |
Support Zones Continue to Protect the Rally
In terms of resistance, Litecoin is still receiving initial support from the 20-day EMA of $43.99, which currently serves as the first line of defense against any new sell-offs.
The $42.39 Fibonacci Retracement, on the other hand, comes in as another critical support zone, where buyers might show their interest in taking some positions.
In case all support zonesA return toward that area would place the recent recovery under renewed pressure.
The specified supportive structure continues to act as a limiting force on Litecoin’s short-term price action amid attempts by the market to identify a new direction.
Key Support Levels
- First support: 20-day EMA of $43.99
- Second support: Fibonacci level of $42.39
- Main support: Previous swing low of $39.17
Directional Indicators Signal a Consolidation
The momentum oscillators continue to highlight the absence of any dominant directional bias in the current price action.
The ADX index currently measures 30.6, showing that the prevailing trend is still quite strong. Nevertheless, the bullish and bearish directional indicators are almost the same, which shows no technical advantage for any of the groups – the bulls or the bears.
Despite the current technical setup suggesting improved momentum compared to the previous lows, the further confirmation of a powerful trend should be a breakout beyond the close resistance levels.
Open Interest Declines as Leveraged Positions Reduce
From the derivatives point of view, there is evidence that speculation in the market has slowed down considerably following Litecoin’s rally. This can be attributed to the open interest falling from above $1.2 billion to $324.8 million due to a reduction in leveraged positions post the retracement in the market.
Moreover, this points toward the fact that the recent retracement was largely driven by long position unwinds and not the accumulation of shorts.
A rise in derivatives activity along with rising prices would signal higher market participation amid any continuation of the rally.
Exchange Outflows Persist Despite Recent Price Downtrend
The on-chain activity scenario is different from what happens in derivatives markets.
As recent statistics demonstrate, Litecoin continues to report net outflows from the centralized exchanges. The last reported net outflow is approximately $564,500, which means that coins keep exiting exchange wallets even amidst poor price action.
Though such outflows are not as large as before, when larger outflows happened, their persistent reduction could lead to lower supply, should the demand increase.
Such a mix of reduced exchange balances and steady accumulation pattern persists alongside current Litecoin consolidation.
Litecoin Price Prediction Still Depends on Technical Validation
Litecoin Price Prediction still hinges on the ability of the cryptoasset to hold above the 20-day EMA level and break above the resistance area of $45.99 to $47.60.
Breaking above the aforementioned resistance area will see focus turn towards $49.89, and thereafter to $50.38 in the form of the 100-day EMA, and then to $52.81 for the full Fibonacci retracement level.
On the other hand, a breakdown below the $43.99 support will have the Fibonacci support of $42.39 in the spotlight, and $39.17 as the key downside reference point.
Frequently Asked Questions (FAQs)
What is the price outlook for Litecoin?
The price of Litecoin is currently trading at about $44.90 after having recovered from its lowest point of $39.17. The current price is trading above the 20-day EMA and below the 50-day EMA, meaning the overall trend is a corrective one.
Where are the key resistance levels?
Resistance levels start at $45.99, followed by $47.60 and $49.89. In case of breakouts above these resistance levels, the next target will be at the 100-day EMA at $50.38 and the Fibonacci retracement level at $52.81.
What are the important levels of support for Litecoin?
Support levels start at the 20-day EMA at about $43.99, then the $42.39 Fibonacci retracement level. Should all the support levels fail, Litecoin may return to the swing low of $39.17.