
Key Insights:
- The downside target at $83.95 has been completed, after the trendline breakdown.
- The $75-$80 range turned into the primary support area.
- The resistance was still strong around $95 to $100, which still restricted recoveries.
Solana traded near $85 after a sharp decline erased gains from earlier highs above $200. Recent charts showed price stabilizing inside a narrow lower range after heavy selling pressure slowed.
The latest market structure placed strong attention on the $75 to $80 support zone. Buyers defended that region while traders monitored whether the current range would hold.
What Happened
Solana remained inside a compressed trading range after months of declining price action. The chart displayed lower highs forming after the previous rally lost momentum. Price dropped from the $200 to $250 region before entering sideways movement near the $80 to $100 zone. That range replaced the earlier aggressive decline with slower market activity.
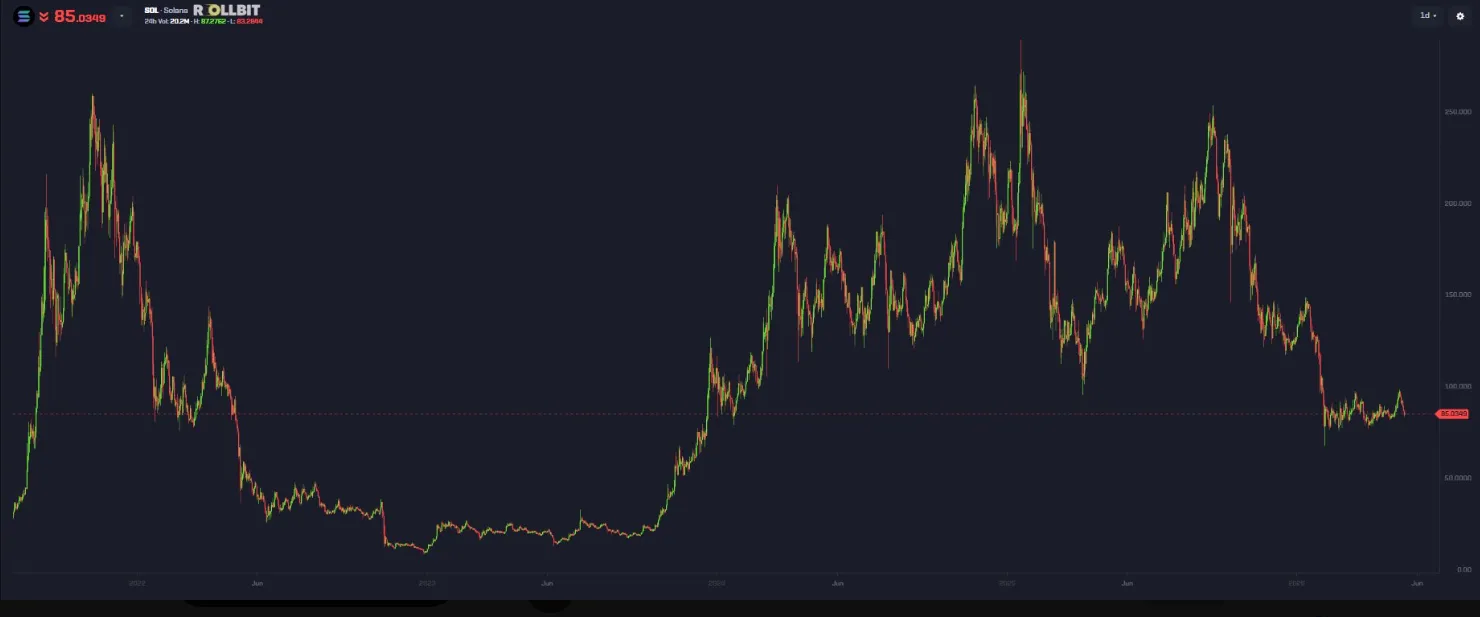
The daily chart showed repeated reactions near current levels as traders waited for confirmation of the next move. Selling pressure weakened after the latest drop, although recovery strength remained limited. A separate 30-minute chart tracked a completed short setup after SOL lost an ascending trendline. The breakdown followed several days of rising price action between May 3 and May 13.
Third Eye shared the trade setup after SOL closed below trendline support. The short entry appeared at $91.97 while the target stood at $83.95. The setup also included a stop-loss at $96.02 above the broken structure. Price later moved into the projected downside zone and completed the target.
Key Market Levels
Current trading range remained between $80 and $100
Main support formed near $75 and $80
Resistance stayed near $95 and $100
Higher resistance remained near $120 and $130
Breakdown target completed near $83.95
Why Current Solana Price Levels Could Define the Next Major Move
The current range controls short-term market direction after a prolonged decline from previous highs. Traders now focus on whether support levels can absorb further selling pressure.
The $75 to $80 area became important because previous reactions formed around that region during earlier corrections. A break below support could expose lower price zones near $60 and $65.
The recent short set up has also confirmed a weakening trend since the rising trend line was broken. The breakdown in that process made it easier for the sellers to take control in the latest session.
The downward momentum was reduced after the sharp drop, as prices stabilized around $85. But buyers still didn’t have any confirmation of a bull market recovery trend.
Solana Market Structure Shifts Into Lower Trading Range
The chart showed that the bulls are moving from an expansion to a consolidation scenario. Lower highs continued appearing after each recovery attempt failed near resistance levels.
Solana remained below the important $95 to $100 resistance area during the latest trading activity. That range now acts as a barrier before stronger upside movement can develop.
A recovery above that zone would place attention back on the $120 to $130 area. Those levels previously acted as active trading regions during the broader decline.
The completed downside target near $83.95 also confirmed technical reactions around broken support structures. Traders watched current levels closely after the projected move finished.
The price of this product is moving upward.
The overall picture revealed that there were two significant rally periods followed by deep pullbacks. There were other peaks earlier around the $250 area in a downward direction before sharp reversals took place.
The price action was flatter in comparison to earlier declines. The trading pattern indicated more sluggish selling following the market’s move into the down range.
The shorter time frame chart confirmed the bearish continuation after the trendline support. After the price lost the ascending structure, sellers took the lead as soon as the price moved up.
The current trade was also in the narrow band around the support area. Price was still trading sideways as traders waited for signals from both the buyers and sellers.
Conclusion
After a sharp drop from recent highs, Solana settled around its lower limit of its recent trading range.Solana settled around its lower bound of its recent trading range after making a significant descent from its previous highs. The focus was on the prospects for support around $75 and $80.
After the failure on lower time frames, the rising trend line was broken during the short time frame, confirming bearish momentum. Current price action now geared towards range stability and resistance/recovery levels.