
- Solana was trading around $76.70 and resistance at $77.27 still constrained the new rally efforts.
- Long positions remained in the majority but the liquidations mostly affected bullish investors in the current price fall.
- Updates on ETF filings and stable derivatives ensured Solana was within the range for the time being.
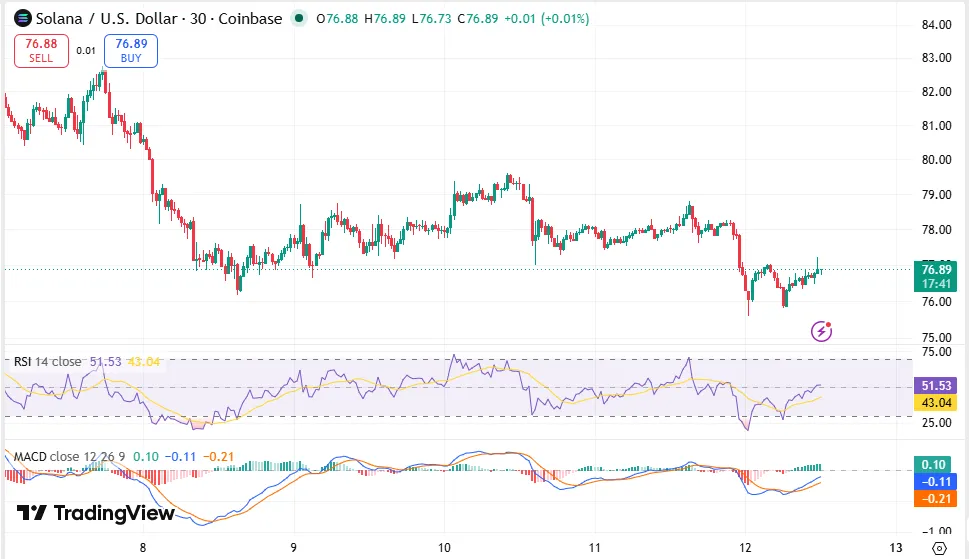
Solana traded for around $76.70, showing a drop of 1.37% against the last 24 hours. In the session, SOL was able to trade above the $78 mark initially before falling back below the $76 level due to heavy selling pressure. Subsequently, the buyers stepped in, and there was a bounce in price that did not go above session highs.
In the 30-minute Coinbase chart, SOL stabilized around the $76.70 level after the intraday drop. Reading of the RSI is 47.17, and momentum is currently neutral and not overbought or oversold. However, the MACD was trading below the signal line, which suggests that momentum is bearish.
Source: Trading View
Technical Indicators
- RSI is neutral: Reading of RSI of 47.17 shows a balanced market.
- MACD is slowing down in bearish trend: Despite the bearish MACD, there is less selling pressure as depicted by the decrease in the histogram.
- SOL is still trading below previous peaks: SOL is still trading below $78 level, where it was unable to hold its gains.
Resistance and Support Levels Remain in Focus
In the one-hour Coinbase time frame, the price of Solana was trading near $76.56 after failing to move above the $77.20 level.
The decline also pushed SOL below the 0.382 Fibonacci retracement at $76.82 and the 0.236 retracement near $76.36 before price stabilized.
Current technical levels identify immediate resistance between $77.20 and $78.12, while nearby support remains around $75.60. The projected trading range over the next two to three sessions extends between $74.75 and $78.14.
Additional moving average data continued reflecting short-term weakness. SOL traded below the 20-period moving average at $77.70 and the 50-period moving average at $78.09 on the hourly chart. In addition, for the daily time frame, the coin was still trading below the 200-period moving average of $92.02.
At the same time, the level of Ichimoku Kijun at $77.27 became the second technical resistance that was under observation by traders.
Important Price Levels
- Resistance range: The first place that buyers have to reclaim is $77.20-$78.12.
- Support level: Maintaining the price above $75.60 might prevent the drop to $74.75.
- Moving averages stay above: SOL is trading below the key moving averages.
Derivative Metrics Show Long Positions Exceed Short Positions
Despite weak price performance, the bias in derivatives positioning remained bullish for market participants on the exchange.
The long to short position ratio of Binance SOL/USDT was 2.2819, while that of OKX was 2.2. The ratio of Binance’s top trader positions was 2.5486, and its top trader account ratio was 1.4768.
While long trades outnumbered shorts, the data regarding liquidations revealed that those who had used bullish leverage suffered the biggest losses during the last market correction.
The total amount of liquidations was recorded to be at $11.41 million in the previous 24 hours. Out of which $10.23 million were long liquidations and $1.18 million were shorts.
Solana Market Snapshot
| Metric | Latest Data |
| Solana Price | $76.70 |
| 24-Hour Change | -1.37% |
| Market Capitalization | $44.65 Billion |
| 24-Hour Trading Volume | $1.63 Billion |
| RSI (30-Minute) | 47.17 |
| MACD | Below signal line |
| Immediate Resistance | $77.20–$78.12 |
| Immediate Support | $75.60 |
| Expected Trading Range | $74.75–$78.14 |
| 24-Hour Liquidations | $11.41 Million |
| Long Liquidations | $10.23 Million |
| Short Liquidations | $1.18 Million |
Open Interest and Funding Rates Signal Measured Activity
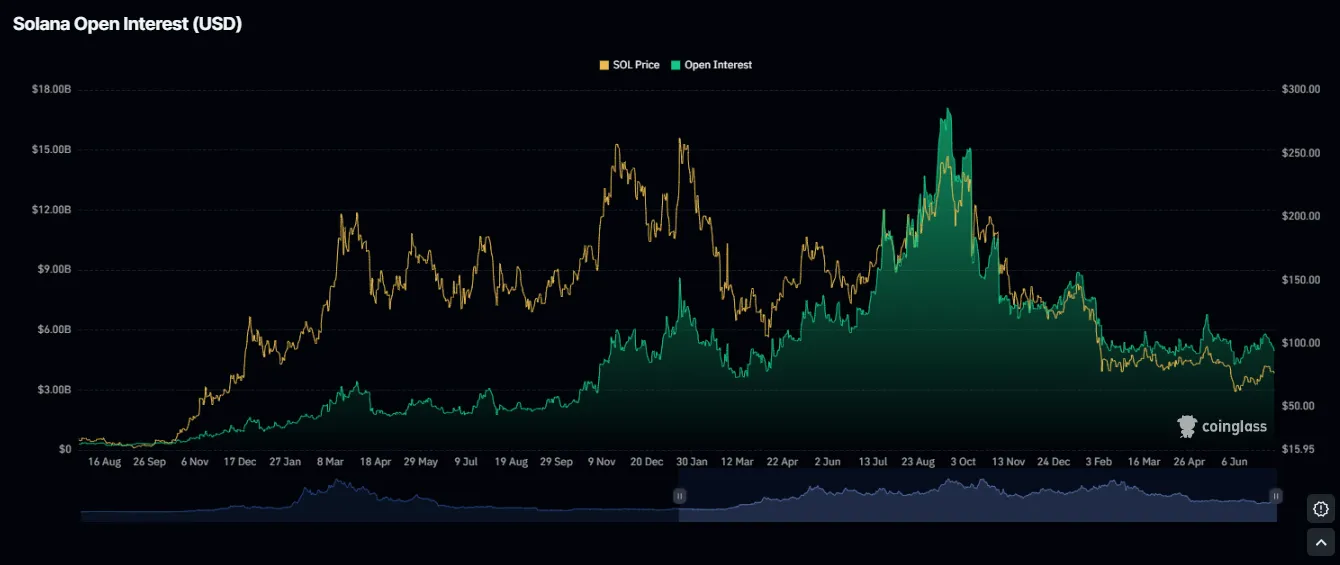
Open interest data showed leveraged participation remained well below previous highs.
After previously exceeding $16 billion when Solana traded near its earlier peak around $280, total open interest declined significantly before stabilizing between approximately $5 billion and $6 billion.
According to Coinglass, there was an increase in open interest, showing that more positions were taken up in the derivatives market. But generally, the trend indicated lower leverage than before.
Source: Coinglass
There was also evidence on balance from the funding rate data.
The weighted funding rate using OI had been fluctuating around the neutral level, shifting from slightly positive and slightly negative. Positive funding bars recently meant that longs were paying shorts for holding their position.
Derivatives data shows that a balance in funding rates and low leverage meant derivatives investors held their positions without further growth.
Institutional Developments Add to Market Monitoring
Recent regulatory filings introduced another development for Solana observers.
Morgan Stanley amended filings submitted to the U.S. Securities and Exchange Commission for a proposed Solana exchange-traded fund. Based on the filing information as per the report by Gncrypto, the plan will include a management fee of 0.14%, staking, and institutional custody.
The filing remains inactive, and no launch date has been announced.
Separately, Cryptobriefing reported that Solana Music is preparing a blockchain-based music distribution platform. The reported development could expand blockchain-based applications on the network, although market pricing continued reflecting broader selling pressure during the latest session.
Solana Price Prediction Points at Consolidation Pattern
The Solana Price Prediction forecast data over the coming two to three trading sessions shows a consolidation pattern rather than any clear direction breakout.
The projected price range remains between $74.75 and $78.14. Technical resistance remains concentrated around $77.27 through the nearby Fibonacci levels extending toward $78.12.
A rise above these resistance levels would boost conditions for recovery in light of the prevailing technical setup. On the other hand, a break below $74.75 would imply bearish pressure according to the given trading range.
Frequently Asked Questions
What is the outlook on Solana prices now?
According to the current technical setup, Solana is expected to consolidate in the $74.75-$78.14 price range during the next two to three trading sessions.
What are the resistances to Solana?
There is a resistance zone at $77.20-$78.12 and another resistance at $77.27 provided by Ichimoku Kijun line.
What is the closest support to Solana?
The immediate support is at $75.60. Break below $74.75 may imply more bearish pressure.