

- XRP remains above its critical support levels as traders keep an eye on the falling trendline for the next breakout move.
- While volume and open interest reduced, short positions still saw higher liquidation than longs.
- RSI has gone to an extremely rare oversold level for a weekly close.
Ripple (XRP) price is driven by the ability of the token to defend its uptrend following a recovery off a critical level of support amid traders’ expectations of the token’s upcoming test of a well-established technical resistance level.
XRP was priced at $1.10 during the most recent session after reversing from recent levels below $1.07, while decreased trade volume and open interest depicted a conservative market. However, technical analysis revealed consolidation of price near a downward-sloping trend line since May.
XRP Price Prediction Centers on Trendline and Key Moving Averages
The daily chart showed XRP making another attempt to move above the descending trendline that has capped every rally since May. An earlier breakout attempt during the first week of July briefly pushed above the trendline before price returned to the previous trading range, creating another retest area between approximately $1.08 and $1.10.
Momentum indicators continued to attract attention. The Relative Strength Index Divergence Indicator was at 46.37 levels, and the bullish divergence that formed in June is still in play.
Although the divergence has not yet produced a confirmed breakout, it continued to coincide with XRP’s effort to stabilize above recent lows.
Price also remained below all major exponential moving averages. The 20-day EMA at $1.1115 represented the nearest resistance together with the descending trendline.
Above that level, the 50-day EMA at $1.1703 marked the next technical objective. Longer-term resistance remained at the 100-day EMA of $1.2712 and the 200-day EMA of $1.4801.
Key Points to Watch
- Price remains above immediate support: XRP continues holding above the $1.08–$1.10 retest zone, while the Fibonacci support at $1.1044 remains intact on the lower timeframe.
- Resistance levels are near: Both the downtrend line and the 20-day Exponential Moving Average (EMA) at $1.1115 stand as the closest resistance level, while the 50-day EMA at $1.1703 is seen as the next level of resistance if a breakout is realized.
Short-term structure reflects consolidation above Fibonacci Support
On the 30-minute chart, XRP was seen trading near $1.1057, having recovered from the $1.07 level that was seen previously in the week. XRP price held above mid-zone support of the Fibonacci Zone near $1.1044, indicating that buyers were active in the present range of trading.
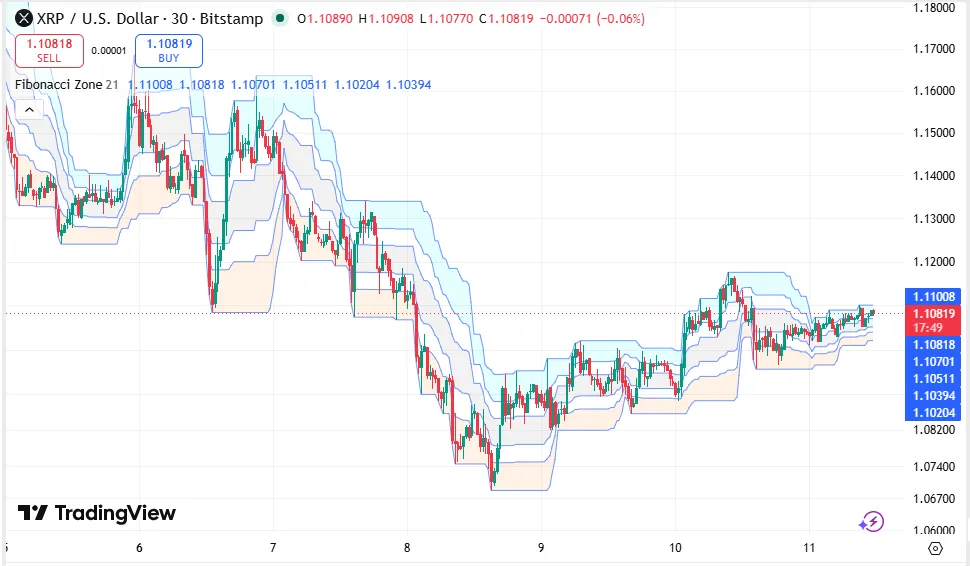
Source: Trading View
Nearby resistance came near $1.1066 to $1.1101, while nearby support came near $1.1031. As can be observed on the chart, the price range of XRP became narrower during the course of the session.
The previous 24-hours chart also displayed a similar pattern. XRP dropped from around $1.115 to around $1.10 level where buying support emerged. Any attempt towards recovery towards $1.11 level faced selling pressure, thereby keeping the asset in a tight range.
XRP Important Levels
| Level | Price |
| Immediate Support | $1.1031 |
| Fibonacci Support | $1.1044 |
| Re-test Zone | $1.08–$1.10 |
| Daily Support | $1.0881 |
| Immediate Resistance | $1.1066–$1.1101 |
| 20-day Exponential Moving Average (EMA) | $1.1115 |
| 50-Day EMA | $1.1703 |
Trading Activity Declines Across Spot and Derivatives Markets
Trading activity decreased during the current session as some metrics regarding market participation witnessed a fall.
The spot market experienced a decline in volume by 34.27% to $1.31
For the past 24 hours, there were liquidations amounting to $981,150. Short liquidations made up of $590,040 while long liquidations amounted to $391,110. For the past 12 hours, there were short liquidations
The most recent hourly data showed only long liquidations totaling $27,130, with no short positions liquidated during that period. Overall liquidation data continued to show larger losses among short traders despite declining overall activity.
ETF Flows and Regulatory Progress Remain Additional Market Factors
Weekly ETF flow data through July 9 recorded net outflows of $7.29 million, placing the previous streak of nine consecutive weeks of positive inflows at risk. Friday’s figures had not yet been reported, leaving the final weekly balance unresolved.
Despite the latest weekly outflow, the total inflows to the ETFs have been sustained at $1.48 billion.
Ripple’s most recently validated MiCA approval from the European Union for 30 European nations was still an existing regulatory event. Nevertheless, the present price action is more related to technical levels than any other recent regulatory news.
Analysts Look For Long-Term Accumulation Indicators
The discussion regarding XRP price forecast also encompassed longer-term technical insights provided by the analysts in the market.
According to Crypto Patel, there is an accumulation zone of high time frame in the range of $0.70 to $1.10 where he mentions the fact that the MACD is close to the bullish crossover on the broad chart.
As per the analysis posted, the resistance level would be $3, and beyond that $9. The analysis described these levels as part of a longer-term outlook rather than a near-term projection.
Separately, entrepreneur and cryptocurrency trader Lark Davis highlighted that XRP’s weekly RSI has entered oversold territory only twice since the asset launched.
According to Davis, the first occurrence came during the 2022 bear market when the weekly RSI declined to 28.09 after XRP fell from $0.8519 to $0.2905. The second occurred during June 2026, when the weekly RSI reached 29.6 after price declined from $1.34 to approximately $1.02.
Frequently Asked Questions (FAQs)
What is the most important support level for XRP today?
Primary support is from $1.08 to $1.10, with lower time frame support found close to $1.1044 and $1.1031. Intraday support at $1.0881 also plays a role.
What are the resistance levels for traders?
Primary resistance will be found in the range of $1.1066 to $1.1101, with the 20-day EMA at $1.1115 coming next. Resistance then turns to the 50-day EMA at $1.1703.
What does RSI say about XRP?
Daily RSI divergence is at 46.37, with a bullish divergence that started in June currently active. Further, RSI on XRP’s weekly chart has entered oversold territory for only the second time in the coin’s history.