
- XRP is above significant support, and any breach above $1.16 will be considered good for the technical picture.
- On long-term charts, XRP is making tests against demand, while RSI is nearing those levels that preceded recoveries.
- Below $0.98, XRP can face $0.74, but there are resistances in the range of $1.27 to $1.42.
XRP price forecast continues to revolve around a number of technical levels as the crypto coin continues with its correction that is now extending into the range that is seen by various market analysts as a long-term support level.
Even though price action has slowed the rate of descent in the past week, the analysts noted that there have been no confirmed reversal patterns. The current technical setup indicates that XRP is at an important technical level from which the next move will be determined.
Key Levels for XRP Price Prediction
| Indicator | Value | Significance |
| Current Price | $1.06 | Trading above the first support level, as per CoinCodex data |
| First Support | $0.98–$0.99 | First demand level spotted by More Crypto Online |
| Downside Target | $0.74 | Next support if the primary demand zone breaks |
| Bullish Confirmation | $1.16 | First level that weakens the bearish Elliott Wave outlook |
| Main Resistance | $1.27–$1.42 | Main supply level where the sellers might reappear |
| Long-Term Trigger | $1.65 | Monthly level marked by EGRAG Crypto |
| Chart Pattern | Declining Channel | Main long-term correction pattern, noted by Rachel Crypto |
| Momentum Indicator | Monthly RSI | Approaching levels of past market lows |
XRP Price Prediction Long-Term Support Level
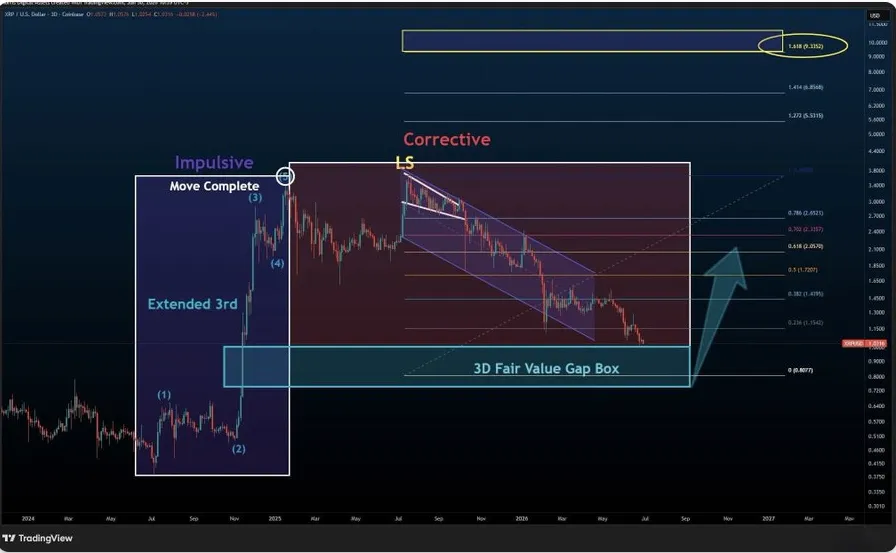
The long-term technical analysis provided by Rachel Crypto indicated that XRP was set to continue moving within the corrective channel downwards formed after completing its impulsive move.
Source: Rachel Crypto
According to the analysis, the corrective move has helped XRP price move into a zone referred to as 3D Fair Value Gap Box, a zone that is historically supported by past demands in the market cycle. The chart has the current price close to the lower end of the corrective channel, where buyers continue holding on to the support level.
The chart has not set a breakout move, but a condition for recovery.The projected move suggests XRP could gradually advance toward higher Fibonacci retracement levels if the current support area continues holding.
The analysis also reported that the market remains within the final stages of the broader correction only if the existing demand zone continues attracting buying interest.
Key highlights
- XRP remains inside a long-term descending corrective channel.
- The 3D Fair Value Gap Box aligns with historical demand.
- Recovery forecasts will continue to rely on support strength.
- Moving Average Highlights the Importance of $1.65
In another monthly analysis by EGRAG Crypto, $1.65 emerges as the most important price point on the bigger picture of XRP’s market.
According to the report, XRP opened lower than the monthly 50-period simple moving average, focusing now on the question of whether the bulls will take control of this price area prior to closing of the month.
From historical chart data included in the analysis, it emerged that XRP would always retest its long-term 88-period simple moving average before moving into expansion modes in the past market cycles.
Based on those historical observations, several possible outcomes were presented. The highest-probability scenario continues to favor another test of the 88-period moving average before any sustained breakout develops.
According to the analysis, maintaining price action above $1.65 would preserve the broader structure while strengthening the probability of higher price targets during future phases of the market cycle.
Important observations
- XRP recently moved below the monthly 50 SMA.
- Previous cycles often included a test of the monthly 88 SMA.
- The $1.65 level remains the primary long-term trigger.
XRP Price Prediction Tracks RSI and Triangle Pattern
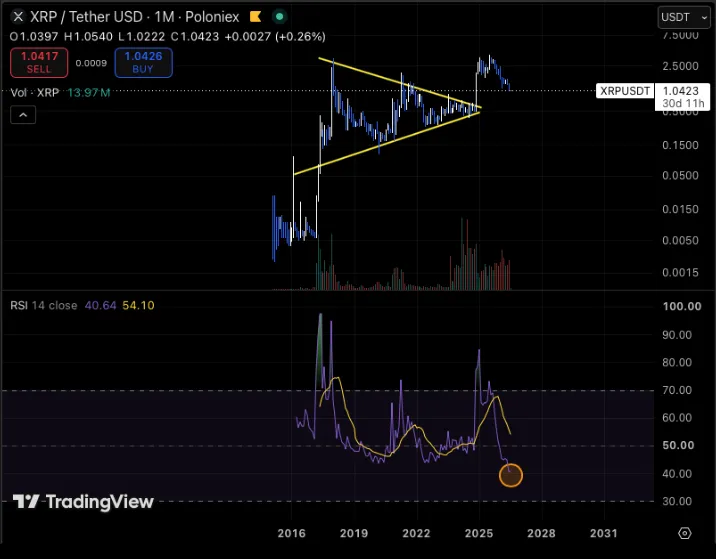
Another technical study highlighted XRP forming a long-term symmetrical triangle while the monthly Relative Strength Index continued approaching the lower portion of its historical range.
Source: Ripples
The analysis was done by comparing the latest RSI values to past market cycles where the momentum rose to comparable levels before turning around to the upside.
Even though the indicator has not generated a valid buy signal, the analysis highlighted the fact that the selling pressure has reduced compared to earlier correction stages.
This means that XRP is consolidating on its longer term technical formation while at the same time the momentum is moving towards critical levels.
Bearish Elliott Wave Pattern Structure Still Valid
Market analyst More Crypto Online stated that the price managed to defend the first level of the support formation but it has not shown enough buying pressure to break the bearish structure.
CoinCodex market data cited in the report showed XRP trading at $1.06, keeping the token above the critical $0.98-$0.99 support zone.
According to the Elliott Wave analysis, the broader outlook continues favoring additional downside unless XRP records a decisive move above $1.16.
The report stated that such a breakout would provide the first technical confirmation that a larger Wave 2 recovery has started.
Current technical outlook
- XRP continues holding above the $0.98-$0.99 support area.
- A move above $1.16 would provide the first bullish confirmation.
- The broader Elliott Wave structure remains bearish until resistance is reclaimed.
Resistance Levels Continue to Define the Market
Even if XRP records a short-term recovery, analysts identified another important technical barrier between $1.27 and $1.42.
The level had been defined as a crucial supply region and selling can accelerate in case bulls fail to make progress here.
According to the analysis, failure to move through this resistance area would support the view that any near-term advance represents a temporary relief rally rather than the beginning of a sustained uptrend.
On the downside, More Crypto Online identified $0.74 as the next major support if XRP loses the $0.98-$0.99 demand zone.
A confirmed break below current support would increase the probability of a deeper corrective phase before stronger price stabilization develops.
Resistance levels to monitor
- Initial bullish confirmation remains at $1.16.
- Strong supply is located between $1.27 and $1.42.
- Loss of $0.98-$0.99 could expose XRP to $0.74.
Technical Levels Continue to Guide the Outlook
The current XRP price prediction remains dependent on whether the market reclaims important resistance levels or loses critical support during the coming trading sessions.
Analysts reported that XRP continues trading between established demand and supply zones after successfully defending its first major support without confirming a broader trend reversal.
The immediate focus remains on $1.16, while $1.27-$1.42 continues serving as the next major resistance region. Separately, EGRAG Crypto’s monthly analysis keeps $1.65 as the long-term trigger capable of preserving the broader technical structure.
Meanwhile, continued defense of the $0.98-$0.99 support area remains critical. A break below that zone would expose XRP to the next major support identified near $0.74, according to the Elliott Wave analysis.
Historical market data referenced in the reports also noted that July has frequently delivered stronger monthly performance for XRP than many other months.
Nevertheless, the technical forecast presented seems to be dependent on verified price behavior rather than seasonal influences only. As a result, support at $0.98-$0.99, resistance at $1.16 and $1.27-$1.42, together with the long-term $1.65 level, remain the primary technical markers shaping the current XRP price prediction.
FAQs
What is the most significant level of support for XRP?
According to More Crypto Online, the main support area is at $0.98-$0.99. Maintaining this level will maintain the existing technical structure.
Why is $1.16 significant for XRP?
The analysis points out that $1.16 is the first level where the current bearish Elliott wave setup can be invalidated, showing the start of a reversal.
What are the resistance levels being watched?
The resistance level was noted to be between $1.27-$1.42 while $1.65 is the key resistance on a monthly scale according to EGRAG Crypto.