Key Insights
- XRP broke below a multi-month symmetrical triangle on the daily chart.
- Price dropped beneath key support levels near $1.368 and $1.329.
- The chart projection shows that $1.14 is the next downside level of interest.
The symmetrical triangle seen on XRP for several months was broken below, sending the price down. XRP broke below a symmetrical triangle that had been helping to buy the price action, mowing it down. The breakdown took the market’s attention to lower support areas and a possible downside target of around $1.14.
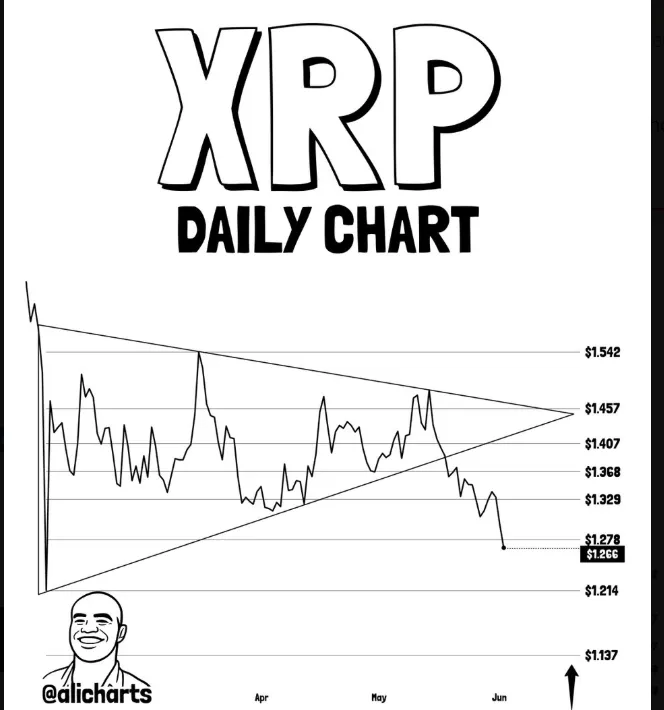
Analyst Ali Martinez presented the daily chart, which had the price break out of the lower edge of the pattern. After the break, the asset has been trading below past support levels, thus establishing a new market structure.
Symmetrical triangle defined trading activity
The chart began from March and continued until the early part of June. In that time frame price stayed in a symmetrical triangle that is converging in price.
The downtrend resistance line restricted the price’s rise during several rallies. Meanwhile, a counter-trend upward support trend line prevented further declines, and kept the pattern in place.
Buyers and sellers jostled for position in between these limits as Price oscillated between them. There were resistance at the lower levels for each rally, and there were support at the higher levels for each decline.
This set up gradually brought about some range tightening and lower volatility. The pattern continued to develop, and price approached the top of the pattern, where the two trendlines were almost parallel.
There were multiple key levels that were evident during the formation. The key upper area of resistance was around $1.542 with another major level coming in at $1.457. There were more reactions around $1.407 and $1.368.
The chart indicated some changes that were resisted in April and May. None of those movements, however, were enough to break out of the upper trendline.
This caused price to get stuck within the pattern until it finally broke out near the end of the pattern.
The price of breakdown is breaking below the support level.
The larger trend below the rising support line was the most important trend on the chart. The consolidation period ended with that break and set up a lower trading structure.
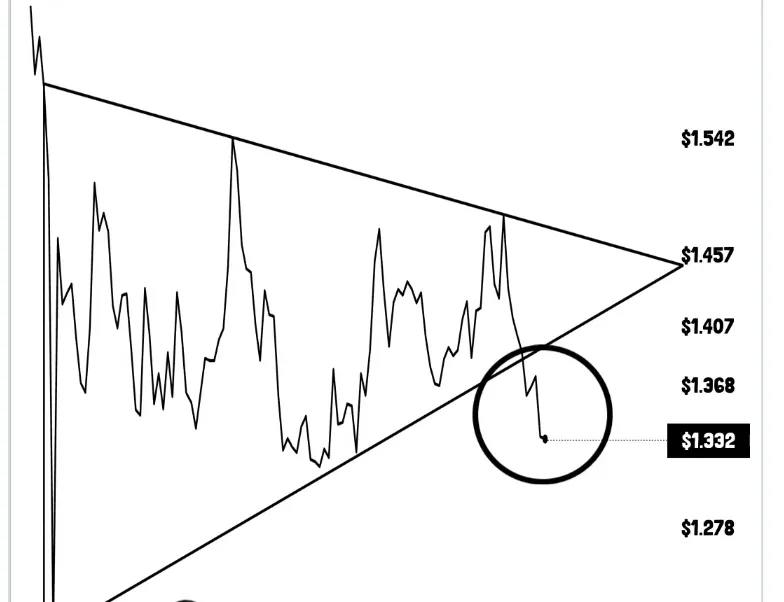
Price has broken out of this triangle and dropped below the $1.368 range. The price continued to fall towards the $1.329 level, which had served as support during the consolidation phase.
The chart revealed a post-breakdown price move around the $1.332 level. The market action was light below the prior support trendline further underlining the downside move.
Price also had trouble getting back into the triangle following the initial break. Rather, the market tumbled on and remained below significant technical levels.
The breakdown was made near the top of the pattern as it had narrowed significantly in terms of volatility. Once support failed, selling pressure accelerated and pushed the asset away from the formation.
Important Levels on the Chart
- Resistance near $1.542
- Secondary resistance around $1.457
- Mid-range level near $1.407
- Support near $1.368
- Lower support around $1.278
- Projected downside target at $1.14
These levels provided the main reference points visible on the daily timeframe.
Project the chart and mark the points at $1.14.
The analyst’s chart was showing $1.14 as the next major target after the breakdown. The projected move appeared below all visible support zones on the chart.
A directional marker also pointed toward the same area, indicating the expected path after the pattern failed. Price remained above that target at the time shown in the analysis.
Technical projections often measure the likely extension of a move after a pattern resolves. In this case, the focus remained on the downside because the break occurred below support rather than above resistance.
The move to the breakdown zone to the target was the expected continuation of the move. Now market participants have a clear reference point as price trades outside of the former range.
The chart showed no indication of a return to the previous consolidation structure. Instead, the projection continued to track movement toward the lower objective.
Market Structure Shifts Lower
The broader trend changed once price exited the lower boundary of the triangle. The balance between buyers and sellers that existed during consolidation was gone.
Lower highs had already developed within the pattern due to the descending resistance line. The breakdown strengthened that weakness by removing the support that had contained previous declines.
The move below the prior supports indicated a change to a bearish structure. The market moved from range-bound conditions into a directional decline.
The chart also recorded continued separation from the broken trendline. Price remained beneath former support, keeping attention on lower levels rather than a recovery into the pattern.
Many traders monitor whether price can reclaim a lost support level after a breakdown. The chart showed no successful recovery at the time displayed, leaving the downside projection unchanged.
Conclusion
XRP completed a confirmed breakdown from a symmetrical triangle that controlled trading activity between March and June. The move pushed price below key support levels near $1.368 and $1.329 while ending months of consolidation. The chart continued to point toward a downside objective near $1.14, with market activity remaining below the former support trendline.