
- The XRP token rallied back above the $1.10 level after a new SuperTrend buy alert was generated amid rising network activity.
- The Santiment analytics platform noted an all-time low MVRV ratio for XRP holders well below their cost basis.
- Net flows into the XRP spot ETF turned positive following price support at the critical $1.00 support level.
The XRP Price stayed under the scanner following the token’s recovery above the $1.10 mark in the recent trading session, despite the general market figures still pointing at the impact of a sustained drop.
XRP gained roughly 5% over the past 24 hours, allowing it to reclaim a key psychological level after trading near recent lows. Despite the short-term rebound, the asset remained more than 50% below its value from a year earlier.
At the same time, fresh on-chain metrics showed that both short-term and long-term holders are experiencing some of the weakest average returns recorded in the asset’s nearly 12-year history.
Technical indicators also presented a mixed picture, with XRP remaining below major resistance levels while defending an important support zone.
Meanwhile, U.S. spot XRP exchange-traded funds (ETFs) returned to positive daily inflows after a brief period of outflows, adding another data point for market participants monitoring the token’s next directional move.
On-Chain Metrics Reach Historic Levels
Recent blockchain data from Santiment showed XRP holder profitability falling to record lows.
According to the analytics platform, XRP’s 30-day Market Value to Realized Value (MVRV) ratio declined to -45%, while its 365-day MVRV dropped to -47%.
The readings indicate that both short-term and long-term holders are holding positions below their average acquisition prices.
Santiment reported that this is the first time in XRP’s history that both groups have simultaneously recorded such weak average returns.
The platform stated that these conditions reflect elevated levels of unrealized losses among holders. It also noted that additional downside cannot be ruled out if the broader cryptocurrency market continues to weaken.
However, the firm added that current valuation conditions represent a different risk profile than periods when holders were broadly profitable because a significant portion of the downside has already been reflected in existing positions.
XRP Price Prediction Signals Improve as Technical Indicators Shift
Technical analysis showed XRP attempting to stabilize after rebounding from $1.0438.
Crypto analyst Ali Martinez reported that the SuperTrend indicator generated its first buy signal since mid-June. According to his analysis, the previous buy signal was followed by a 14% price increase.
Martinez also noted that the same indicator previously identified two major declines of 19% and 16%, making the latest signal a notable technical development.
Separate network data cited by Martinez showed increasing blockchain activity during recent weeks. Daily active XRP addresses increased from approximately 23,000 on June 14 to nearly 40,000, reflecting higher on-chain participation.
Nevertheless, despite all these events, XRP was still trading under a number of significant technical resistance levels.
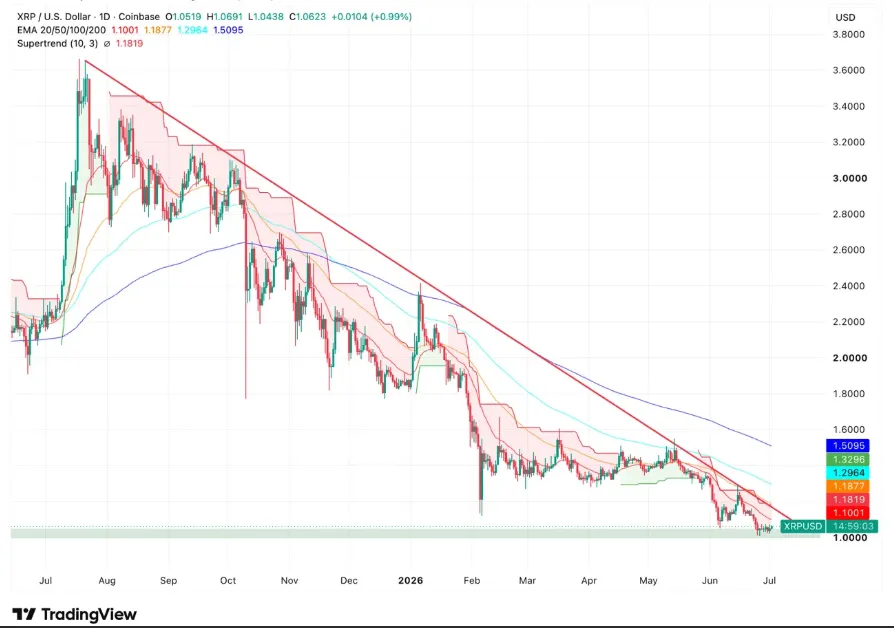
According to the daily chart, XRP was still trading under the 20-day EMA level of $1.1001 and the SuperTrend resistance level of $1.1819. Other resistance levels were at the 50-day EMA level of $1.1877, the 100-day EMA level of $1.2964, and the 200-day EMA level of $1.5095.
There was also a descending trendline formed from the high point of August 2025, which was near the $3.60 price level.
Support and Resistance Levels Are Still Well-Defined
Price action continued to form inside a defined trading range.
XRP has held the horizontal support area between $1.00 and $1.05 for nearly two weeks without breaking lower. The latest rebound originated from $1.0438, leaving that level as immediate support alongside the $1.00 psychological level.
On the upside, the first technical barrier remains the 20-day EMA at $1.1001.
Source: Trading View
Above that level, the SuperTrend indicator at $1.1819 represents the next resistance zone. The broader trend continues to show multiple moving averages positioned above the current price, reflecting the existing market structure
| Key Technical Levels | Price |
| Current Support | $1.0438 |
| Psychological Support | $1.00 |
| 20-day EMA Resistance | $1.1001 |
| SuperTrend Resistance | $1.1819 |
| 50-day EMA | $1.1877 |
| 100-day EMA | $1.2964 |
| 200-day EMA | $1.5095 |
ETF Flows and Derivatives Activity Provide Additional Market Data
Institutional flow data showed mixed activity during the opening days of July.
U.S. spot XRP ETFs attracted more than $59 million in net inflows during June. After having registered two successive flows on a daily basis, the capital turned positive on July 3 with net inflows of $6.55 million.
Source: Coinglass
Data from SoSoValue showed that Bitwise’s ETF accounted for the largest share of the day’s inflows.
Earlier, ETFs recorded $2.83 million in net outflows on June 30, followed by another $1.86 million in outflows on July 1, marking the first back-to-back daily outflows since March. Bitwise recorded a $4.75 million single-day outflow during that period, while Franklin’s XRPZ added $2.88 million, partially offsetting the decline.
Despite those daily withdrawals, cumulative net inflows remained at approximately $1.48 billion, while the ninth consecutive week of positive weekly flows remained intact. Data also showed $3.31 million in positive spot ETF net flows on July 2.
Derivatives markets reflected changing positioning among traders.
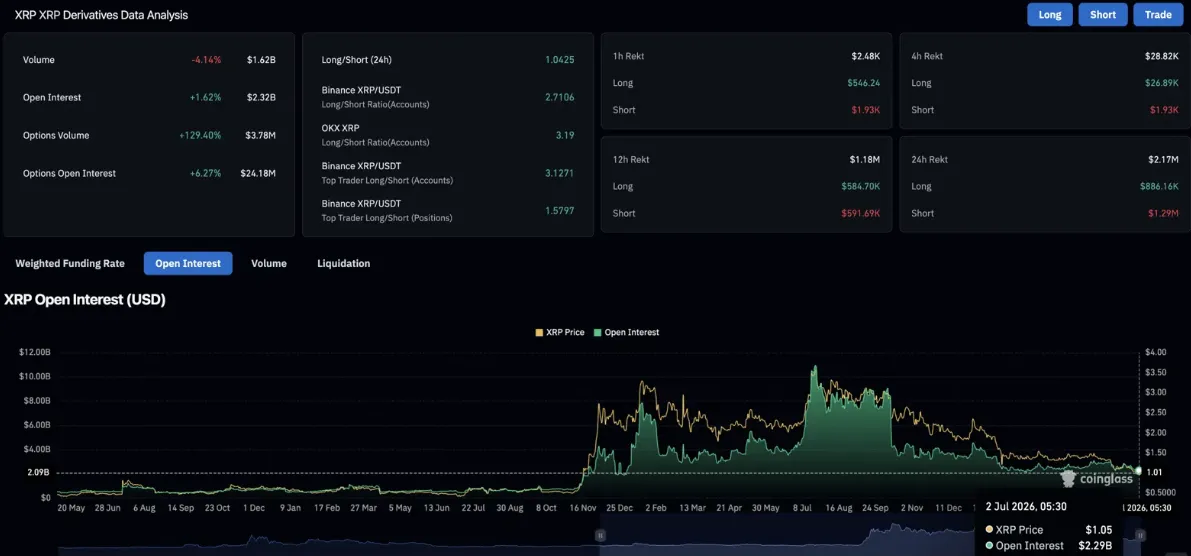
Spot trading volume declined 4.14% to $1.62 billion, while open interest increased 1.62% to $2.32 billion. Options trading volume rose 129.40% to $3.78 million, representing the largest increase across the derivatives market during the reporting period.
Moreover, the total amount of liquidations within the last 24 hours is $2.17 million, with short liquidations amounting to $1.29 million, and long liquidations totaling $886,160. In the last 12 hours, there was almost an equal number of short and long liquidations, at $591,690 and $584,700, respectively.
FAQs
Why is XRP Price Prediction still popular?
XRP Price Prediction continues to be in the spotlight following the token’s recovery above $1.10 despite being historically unprofitable for its holders and having increasing activity in the network, as well as inflows of US XRP ETFs.
What does the current MVRV signal about XRP?
According to Santiment, the 30-day MVRV metric of XRP is -45% and its 365-day MVRV is -47%, meaning both short-term and long-term holders have been holding the coin below their purchase cost.
What are the key support and resistance levels for XRP?
The nearest support is found at $1.0438 and then comes the psychological support at $1.00. The immediate resistances are the 20-day EMA at $1.1001 and the SuperTrend indicator at $1.1819.