

- Bitcoin is currently trading at $63900 amid two failed attempts to test $65000.
- ETF inflows have been restored after earlier ETF outflows; however, year-to-date flows still indicate lower demand for the funds.
- Technical support is still seen at $62578 while resistance at $65000 will define further market direction.
Bitcoin price prediction is centered on the question of whether Bitcoin will be able to return to higher resistance levels following another failed attempt to hold trade volumes above the $65,000 mark.
Market conditions are defined by technical resistance, the flow of ETF funds back into the market, the July rally, and changes in derivatives positions.
While bitcoin continues trading above nearby support, its inability to hold trade volumes above $65,000 is making technical levels more important again.
In addition, while ETF demand is improving compared to other sessions amid annual outflows, derivatives figures indicate that trades are closing out their existing positions rather than creating new ones.
Bitcoin Price Prediction Shows Resistance Returning Below $65,000
Bitcoin was trading around $63,928.79, up 1.82% within 24 hours after pulling back above $62,600 to consolidate around $63,900. The asset briefly climbed to $65,235 following lower-than-expected U.S. CPI data but failed twice to hold above $65,000, leaving the 20-day EMA at $63,219 as immediate resistance.
Key takeaways
- Bitcoin traded around $63,928.79, up 1.82%.
- Market capitalization reached $1.28 trillion.
- Trading volume totaled $21.45 billion, down 27.06%.
Technical Levels Determine Short-Term Direction
The support line drawn by the Bollinger band midline of $62,578 is the closest one. Further below that, support area between $58,500 and lower Bollinger Band at $59,075 is considered as the next technical level for Bitcoin.
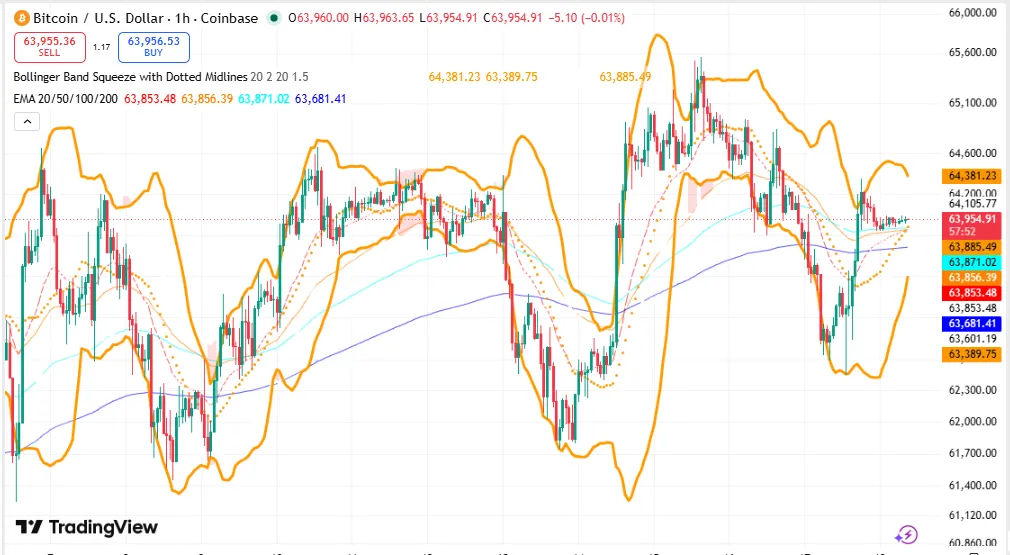
Source: Trading View
Bitcoin Technical Levels
| Indicator | Level | Importance |
| Current Price | $63,928.79 | The current price level |
| 20-Day EMA | $63,219 | First resistance level |
| 50-Day EMA | $64,947 | Resistance at upper limit |
| Upper Bollinger Band | $66,082 | Upper range resistance |
| Bollinger Midline | $62,578 | Immediate support level |
| Lower Bollinger Band | $59,075 | Major support level |
| Horizontal Support | $58,500 | Low support level |
| 100-Day EMA | $68,261 | Long-term resistance |
| 200-Day EMA | $74,278 | Long-term resistance |
Bitcoin Price Prediction Reflects Historical July Performance
July has historically ranked among Bitcoin’s strongest months. Over the past 13 years, the month has produced an average return of 7.59% and a median return of 8.16%, finishing positive in nine years.
Bitcoin’s current 7.43% monthly gain remains close to that historical average with two weeks remaining in the month.
Historical July data
- Average July return is 7.59%.
- July has closed positive 9 out of 13 years.
- Current monthly gain stands at 7.43%.
Derivatives Data Points to Position Closures
On July 17, derivatives volume increased 2.52% to $50.30 billion, while open interest declined 1.74% to $46.88 billion, indicating positions were being closed rather than new leveraged trades entering the market.
Long liquidations totaled $64.19 million, compared with $12.77 million for shorts. Meanwhile, options volume declined 41.24% to $1.92 billion.
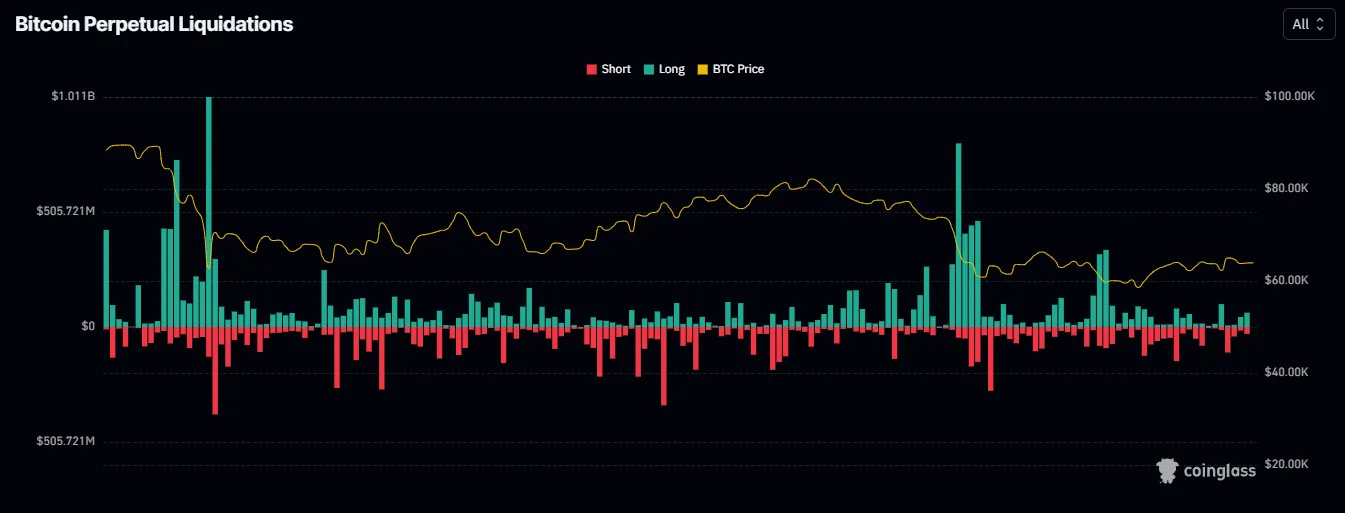
Source: Coinglass
Latest derivatives metrics
- Volume rose to $50.30 billion.
- Open interest declined to $46.88 billion.
- Long liquidations exceeded short liquidations by roughly 5:1.
ETF Inflows Resume Following Earlier Outflows
The net inflows to U.S. spot Bitcoin ETFs on July 15 were $107.80 million, and on July 16, $79.15 million. IBIT of BlackRock got $33.44 million, FBTC of Fidelity attracted $30.73 million, and BITB of Bitwise got $14.9
Cumulative net inflows have reached $51.22 billion, while total net assets stand at $77.72 billion.
Recent ETF activity
- Net inflows totaled $186.95 million over two sessions.
- Cumulative ETF inflows reached $51.22 billion.
- Total ETF assets now equal $77.72 billion.
ETF Demand Remains a Focus for Market Participants
CryptoQuant contributor IT Tech reported that spot Bitcoin ETFs accumulated more than 500,000 BTC during 2024 and approximately 250,000 BTC in 2025.
On the other hand, 2026 has seen around 120,000 BTC in total outflows. The analyst mentioned that ETF demand had helped Bitcoin’s market performance in the past, and the change in cumulative flows is an evolving market variable.
Long-term ETF trend
- More than 500,000 BTC went to ETFs during 2024.
- Close to 250,000 BTC went to ETFs in 2025.
- Some 120,000 BTC has been taken out of ETFs in 2026.
FAQs
What is Bitcoin’s nearest resistance?
The nearest resistance is a 20-day EMA of $63,219, followed by a 50-day EMA of $64,947.
Where can Bitcoin find its nearest support?
The immediate support is found at $62,578, and the extended support range is from $58,500 to $59,075.
What does the most recent derivatives data indicate?
Increase in volume and decrease in open interest means closing of existing positions rather than taking up new leveraged positions.