
- The Bitcoin price hovered beneath $64,000, and sellers were in charge since the momentum was declining at significant technical levels.
- The US spot Bitcoin ETF saw $233.1 million in inflows and went back to positive weekly flows after Thursday’s trading session.
- The long contracts remained strong while open interest remained low.
Bitcoin price remained under pressure during the latest trading session, with the cryptocurrency holding below the $64,000 mark as technical indicators pointed to continued short-term weakness.
Despite the decline, U.S. spot Bitcoin exchange-traded funds (ETFs) recorded their strongest daily inflows in more than three weeks, helping push weekly flows back into positive territory.
Bitcoin Price Trades Below Key Technical Levels
Bitcoin price traded at $63,760, down 0.68% over the previous 24 hours. Its market capitalization was at $1.27 trillion, while the 24-hour trading volume amounted to $28.7 billion.
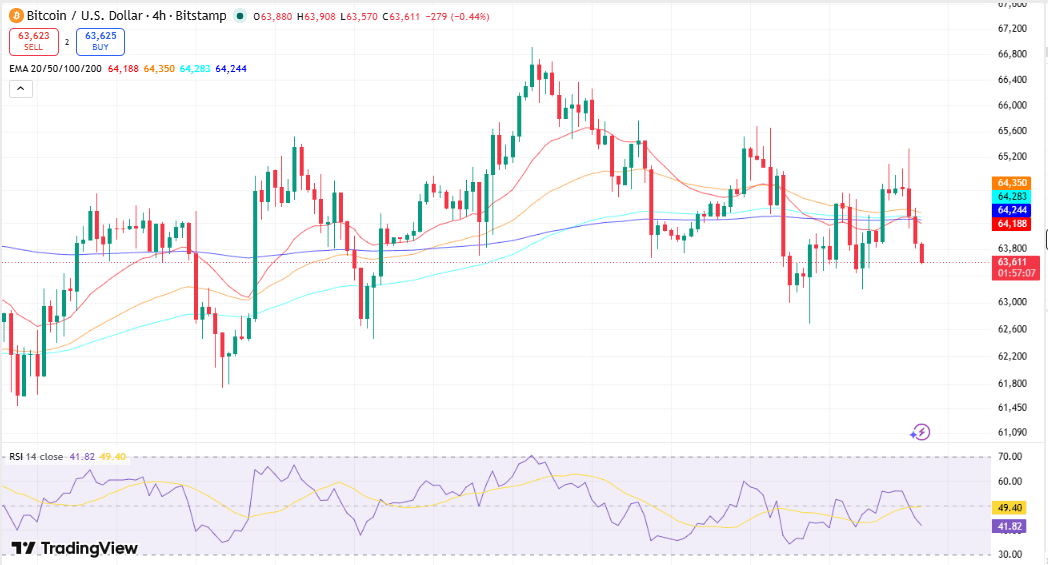
In the four-hour timeframe, Bitcoin traded around $63,773 as it prolonged its recent consolidation. The coin stayed below its 20, 50, 100, and 200 EMAs that were ranging from $64,204 to $64,286.
Source: Trading View
The latest candlesticks also reflected sustained selling pressure during the session. Moreover, the Relative Strength Index (RSI) declined to 43.55, which is below the signal line at 49.52. Despite momentum having dropped, the indicator was not yet in oversold territory.
Important Technical Levels to Consider
- Resistance is currently in the range of $64,204 to $64,286, where the 20, 50, 100, and 200 EMAs congregate.
- Support is found at $63,199, with another lower support at $62,
- The RSI reading of 43.55 signals weakening momentum but remains above oversold conditions.
Bitcoin Price Tests Fibonacci Support
Additional chart data showed Bitcoin price slipping beneath the 0.382 Fibonacci retracement level at $63,835 after failing to maintain momentum near $64,475.
The next identified support level stood near $63,199, while a recovery above $64,186 could place price back above a key technical threshold. Until then, the market continued trading below several nearby resistance levels established during the recent decline.
Separate support and resistance analysis also identified $62,684 as another notable downside level, while $65,680 remained the next significant resistance should buying pressure strengthen.
Spot Bitcoin ETFs Return to Positive Weekly Flows
While technical indicators remained under pressure, institutional investment products recorded fresh inflows. The U.S.-listed Bitcoin ETFs gathered $233.1 million in net inflows on Thursday, posting their biggest net one-day inflow in over three weeks.
According to SoSoValue figures, BlackRock’s iShares Bitcoin Trust (IBIT) gathered $183.4 million, making up 78.7% of the total net inflows for the day.. Bitwise’s BITB added $20.7 million, while Fidelity’s FBTC recorded $15.5 million. Several other funds also posted smaller positive flows.
Following Thursday’s activity, Bitcoin ETFs moved back into positive territory for the week with $203.84 million in cumulative net inflows. Unless Friday records net outflows exceeding that amount, the products remain positioned to complete a fourth consecutive week of positive net flows.
Monthly data also improved after Thursday’s session. July shifted to $437.8 million in net inflows, placing the month on track to end a two-month period of multibillion-dollar net outflows.
At the time the ETF data was reported, Bitcoin traded near $64,338, according to CoinGecko, representing a 1.8% decline over the previous seven days.
Meanwhile, U.S. spot Ether ETFs posted $13.3 million in net inflows on Thursday. During July, the funds recorded losses on only five trading sessions after registering positive inflows on four trading days throughout June.
ETF Flow Highlights
- U.S. spot Bitcoin ETFs added $233.1 million in daily net inflows.
- BlackRock’s IBIT contributed $183.4 million, representing most of the day’s inflows.
- Weekly Bitcoin ETF Inflows stood at $203.84 million, and July became positive for $437.8 million worth of net inflows.
Bitcoin Derivatives Market Data Points to Long Bias with Stable Open Interest
The Bitcoin derivatives markets maintained a high bias toward long positions compared to short positions.
The Binance BTC/USDT long-to-short account ratio was still over 1.6, implying more longs than shorts on the tracked accounts. However, liquidations were ongoing on both sides of the market.
During the past 24 hours, total Bitcoin liquidations reached $51.42 million. The long liquidations totaled $17.65 million, and the short positions added up to $33.78 million, meaning that the bears suffered more losses from the positions forced to be closed.
Open interest figures revealed that there was a change in leverage participation. The open interest in Bitcoin had dropped to about $45-$50 billion from levels higher than $90 billion.
FAQs
Why is Bitcoin trading below $64,000?
Bitcoin is still trading below $64,000 after the fall below the exponential moving average levels and the 0.382 Fibonacci retracement levels.
What was the total net inflow amount of spot Bitcoin ETFs in the U.S.?
A net inflow of $233.1 million was witnessed in U.S. spot Bitcoin ETFs on Thursday, which was the highest daily inflow since more than three weeks ago.
What does the numbers on derivatives show?
The long-short ratios on Binance was greater than 1.6, indicating that there were more long positions than shorts. Moreover, the total 24-hour Bitcoin liquidations amounted to $51.42 million.