

- Ethereum Price Prediction reveals ETH trading above crucial support level of $1819 with resistance
- Long positions still outnumber shorts but recent selling liquidated over $53 million in bullish trades.
- Analysts watch $2200 and $2245 while Ethereum ETF outflows returned after two days of inflows.
Ethereum Price Forecast remains to be one of the hotly-debated topics as the ether token continued to decline in value from its short-term advances but managed to stay above a major support at $1,819.
In today’s 24-hour trading session, Ethereum was valued at $1,827 amid a daily loss of 2.41%, as the technical indicators, derivatives, fund flows, and on-chain data were sending mixed signals.
Meanwhile, ETH remained under downward pressure following a pullback from the levels of $1,945. Meanwhile, derivative markets remain bullish, even after massive liquidations, and U.S. spot Ethereum ETFs have resumed their net outflows.
On-chain data has also seen that Ethereum recovered its MVRV pricing band, which is historically linked with moves towards its realized price.
Ethereum Forecast Signals Critical Technical Levels
Ethereum was trading at $1,827, dropping roughly 2.41% in comparison with the last 24 hours. This price drop came after a continued downward move from around $1,882. Even though there was some recovery in the market, the sellers took control of the price action.
Market cap was recorded at $220.48 billion, while the 24-hour trading volume declined by over 21% to $10.82 billion.
On the hour chart, Ethereum was trading below the 20, 50, and 100 exponential moving averages (EMAs), indicating the ongoing weakness in the short-term movement. Nonetheless, the 200 EMA at $1,827 kept serving as an immediate support.
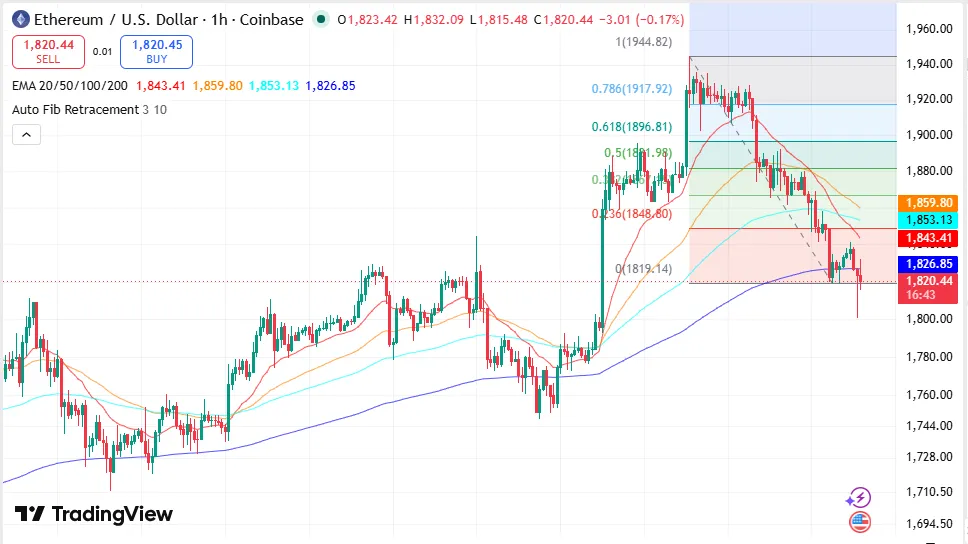
Source: Trading View
Relative Strength Index (RSI) was at 32.84, approaching the oversold level, whereas the Parabolic SAR indicator stayed above the price, confirming the existing downtrend.
| Indicator | Value | Status |
| Current Price | Around $1,827 | Trading above key support |
| 24H % Change | -2.41% | Bearish session |
| Market Capitalization | $220.48B | Lower than previous day |
| 24H Volume | $10.82B | Down over 21% |
| Relative Strength Index (RSI) | 32.84 | Near oversold |
| 200 EMA | Around $1,827 | Immediate support |
| Fibonacci Resistance | $1,848.80 | Price remains below |
Support and Resistance Continue Defining the Outlook
Ethereum is trading below the 0.236 Fibonacci retracement level of $1,848.80, putting the sellers back in charge of the market.
Primary Support Level
The first significant level of support is $1,819.
The 200 EMA near $1,827 continues providing dynamic support.
A move below $1,819 could expose lower price levels.
Key Resistance
$1,840 is the nearest resistance.
$1,848.80 marks the first Fibonacci retracement.
$1,940-$1,945 remains the broader resistance zone.
Observing Ethereum Price Forecast: Influence of Derivatives and Blockchain Metrics Despite low spot prices, derivatives still indicate that there is a tendency among investors towards a bullish position.
On Binance, there was an ETH/USDT long/short position account ratio at 2.251, with the largest trader account having a ratio of 2.0581. The highest account ratio on OKX was 1.82.
| Derivatives Metric | Value |
| Binance Long/Short Ratio | 2.251 |
| Binance Top Trader Ratio | 2.0581 |
| OKX Long/Short Ratio | 1.82 |
| 24H Total Liquidations | $67.52M |
| Long Liquidations | $53.35M |
| Short Liquidations | $14.17M |
Important Market Notes
- Longs still dominate on all important exchanges.
Liquidity by longs made up the majority of liquidations during recent falls
Bullish positioning continues despite short-term price weakness.
Moreover, Ali Martinez pointed out that Ethereum has gone back into the 0.8 MVRV Pricing Band even though it dipped below that range for some time.
According to prior market trends in the last six years, Martinez found that Ethereum’s Realized Price at $2,245 was the next important historical mark.
Analysts Outline Next Price Levels While ETF Outflows Resume
According to Tony Research, Ethereum’s correction into the $1,800 region could be followed by a recovery toward $2,000. The analysis also stated that ETH could extend toward $2,200 if Bitcoin advances to $70,000.
The report further outlined a possible seven-to-ten-day distribution phase, followed by another decline toward $1,260-$890, a range identified as a potential dollar-cost averaging zone before a future bull cycle. The projected sequence remains dependent on Bitcoin’s performance.
Institutional flows weakened during the latest session as U.S. spot Ethereum ETFs recorded more than $28 million in net outflows after two consecutive days of inflows. Grayscale’s ETH trust was responsible for leading the way out in terms of the highest outflows at approximately $14.3 million, followed by Fidelity FETH at $11 million, with Grayscale ETHE at roughly $4.8 million in outflows.
FAQs
What is Ethereum’s support level right now?
The current support level of Ethereum is $1,819, with an added support level at 200 EMA, which stands at approximately $1,827.
What are some resistances to note?
Some resistances to take note of are $1,840, $1,848.80, and the overall resistance at the $1,940-$1,945 range.
Why is $2,245 important?
According to Ali Martinez, Ethereum’s real price is set at $2,245 after ETH gained back the 0.8 MVRV Pricing Band, a level historically associated with rallies toward the realized price.