
- ETH is trading at a price above $1650 and traders are looking for the crucial resistance range between $1739 and $1750.
- ETFS had an inflow of around $29 million and there were institutional activities that contributed to positive market sentiments.
- Ether has outpaced Bitcoin in six sessions but the overall trend needs technical validation.
The Ethereum Price was under watch once again with Ether’s recent rally continuing thanks to the latest institutional moves and inflows into exchange-traded funds. The price of ETH stood at $1,690.61, marking a rise of 4.73% in the last 24 hours.
At the same time, ETH was still trading below several key moving averages as the technical structure for the asset remained intact despite the recent rally.
Recent developments include the announcement of Ethereum Institutional, a new organization founded by Bitmine Immersion Technologies, SharpLink, and Ethereum co-founder Joe Lubin, among others.
Ethereum Forecast Suggests Resistance Despite Recovering
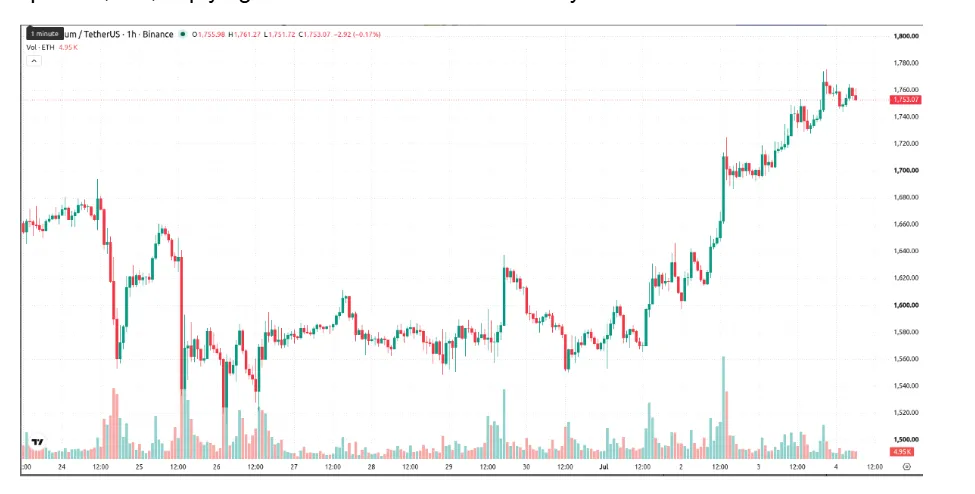
Ethereum has rallied past the earlier-mentioned $1,650 area, bringing about changes in the short-term technical setup amidst the earlier correction. Nonetheless, the cryptocurrency is trading below various trend lines.
The 20-day moving average is at $1,748, while the 50-day moving average is found around the $1,710 area. Further, the more significant 200-day moving average has held up at $2,275, implying that the overall trend has not yet been reversed.
Source: Trading View
In addition to other notable technical levels are the Ichimoku Kijun on a daily level at $1,739, serving as a near resistance level to Ethereum.
Momentum oscillator levels were a bit conflicting even after the rally.
Important technical levels are as follows:
| Indicator | Current Signal |
| MACD | Buy |
| ADX | Strong Buy |
| RSI | 64.64 |
| CCI | Buy |
| Bull/Bear Power | Overbought |
| Stochastic RSI | Neutral |
| Awesome Oscillator | Neutral |
The RSI level of 64.64 indicated the momentum is getting stronger but not reaching any extreme level yet, while Bull/Bear Power indicated that the market is becoming overbought.
The neutral levels of Stochastic RSI and Awesome Oscillator confirmed the lack of general confirmation from all momentum oscillators.
Institutional Initiatives Enable Ethereum Participation
Institutional involvement continued to be one of the main developments concerning Ethereum in the recent recovery.
Ethereum Institutional, an independent non-profit organization founded by Bitmine Immersion Technologies, SharpLink, and Joe Lubin, who co-founded Ethereum, provided another institution that would aim at facilitating institutional involvement in on-chain finance.
As noted in the press release, this initiative was meant to promote tokenization, blockchain infrastructure, institutional involvement, and overall enterprise use of Ethereum.
Other developments that pointed to increased institutional activity included:
- Ethereum spot ETFs recorded $29 million in net inflows.
- The Ethereum Foundation announced new guidelines, which were dedicated to institutional adoption.
- Blockchains for enterprises and governments continued to be among the foundation’s goals.
According to SoSoValue, Ethereum ETFsspot saw $29 million worth of net inflows on July 2. This was a positive development for the market, considering that it experienced outflows for quite some time. However, the figure was still low compared to other periods when institutions used to buy.
ETH/BTC Ratio Reflects Improved Performance
Data from the market also revealed some improvements in the relative performance of Ethereum.
The ETH/BTC pair gained ground on six consecutive trading days, meaning that Ethereum did better than Bitcoin over this time. This was due to the improved relative strength.
Despite the recent improvement, the ratio remained near historically low levels. Current market data, therefore, continued to characterize the recovery as a technical improvement rather than confirmation of a longer-term rotation into alternative cryptocurrencies.
The available figures also showed no confirmed evidence that a broader altcoin cycle had begun.
Short-Term Trading Range Remains Defined
Current price projections continue to identify a relatively narrow short-term trading range.
ETH is expected to trade between $1,639 and $1,744 for the upcoming one or two trading days within the basic scenario.
Some significant technical levels to watch out for are as follows:
- Support: $1,639
- Breakout level: $1,650
- Immediate resistance: $1,739
- Resistance: $1,750
- Next technical level: $1,827 (50-day SMA)
A price break above $1,739 will nullify the immediate resistance from the Ichimoku Kij If buyers also establish a sustained move above $1,750, the next technical objective would become the 50-day simple moving average near $1,827.
Conversely, a decline below $1,639 would place the recent recovery under renewed pressure and could reopen downside risk over the short term.
Further candlestick formation has suggested that the price action was nearing resistance due to several positive sessions. The market data has shown that more volume would be needed near $1,750 to continue higher.
Technical Obstacles Remain for Medium-Term Structure
Despite the improvement of the short-term structure for Ethereum, the technical picture for the medium term is still the same.
The asset continues to trade below the 200-day moving average and remains under the broader downtrend that has defined recent months. Market data indicated that reclaiming the $2,000 level would represent an important technical milestone before a broader accumulation phase could be confirmed.
Developments within institutions, ETF investments, and the rising ETH/BTC rate have been observed to coincide with strong short-term momentum.
Nevertheless, the ETF flows are still rather modest, and the current recovery period has not been confirmed with more technical indicators.
Frequently Asked Questions (FAQs)
What is the current Ethereum price forecast?
Currently, the near-term view sees Ethereum trading within the range of $1,639 – $1,744 in the coming one to two trading sessions. The breaking of the $1,739 resistance will be seen as an additional positive signal, whereas the breakdown of $1,639 will lead to downside pressures.
Why is the recent rise in Ethereum prices drawing attention?
It was reported that Ethereum is up 4.73%, regaining the $1,650 level amid the launch of Ethereum Institutional and new spot ETF inflows and favorable momentum readings.
What are the primary resistance levels for Ethereum?
Primary resistance stands at the Ichimoku Kijun at $1,739, followed by the $1,750 level. Once both resistances are broken, the next technical target stands at the 50-day SMA at $1,827.