
Key Insights:
- Ethereum price hit its projected $2,150 support level after breaking through multiple resistance levels.
- Buyers have rallied to the side of the support area as volatility has slowed in the consolidation.
- The $2,400 and $2,800 levels were again important obstacles to overcome.
Ethereum bounced back around the $2,150 support area after a significant sell-off on recent trading. Price action has hit the predicted support zone and then consolidated above lower price demand.
Ethereum breached a few resistance levels on the chart throughout the correction period. The highlighted support region was later justified by the buyers as the market became less volatile.
The cryptocurrency Ethereum is facing critical market support.
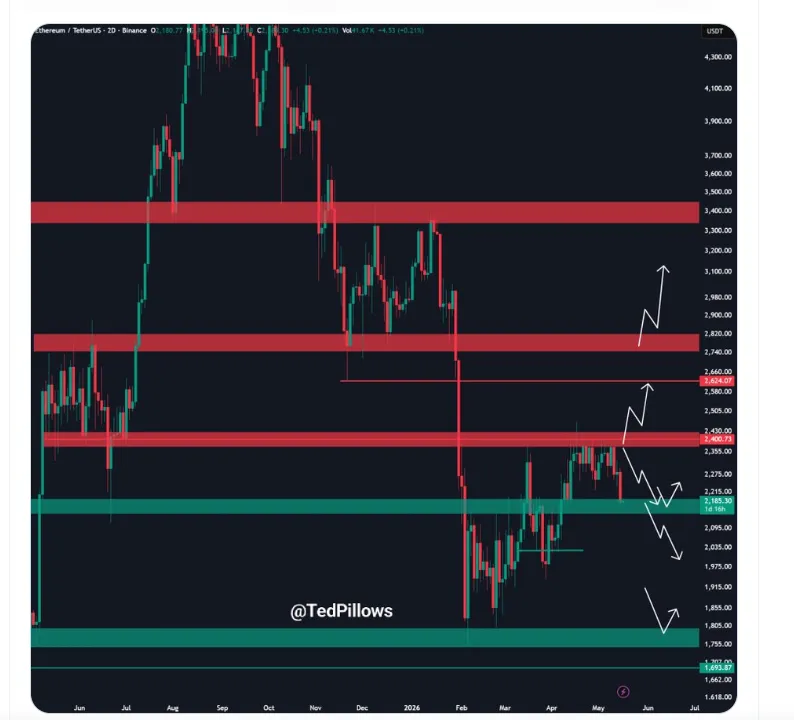
During the previous bullish trend, Ethereum rose above $4,000, only to be taken over by the sellers. The asset subsequently developed lower highs and lower lows over a few months.
Price action then started to test the $3,400 resistance level, but failed, leading to a breakout below this price point. During the downtrend, the market also had difficulty in remaining above the $2,800 level.
There was a major bearish candlestick following from the $2,624 support level that was lost by ETH. That move pushed the asset toward the $2,150 demand area marked on the chart.
The decline reached a local bottom near the lower green support region. Buyers later returned as price recovered above the recent lows. Ethereum continued trading inside that range while market participants monitored direction.
Key market levels
Resistance remained near $2,400
Higher resistance stayed around $2,800
Major resistance continued near $3,400
Immediate support held around $2,150
Lower support appeared close to $1,800
Support defense influence market momentum
Ethereum defended the projected support area after several weeks of downside pressure. That reaction confirmed active buying interest near the lower demand zone.
The market previously reacted strongly around the same support structure. The traders’ interest has been on the rise since the latest retest where historical reactions took place.
The stock is trading north of $2,150 helping to ease the near-term selling pressure seen in recent trading sessions. The trend is now steady, as prices have moved above the support, allowing traders to try to recover their positions in the short term.
The chart showed several projected recovery paths if buyers maintain control above current levels. Those paths included possible movement toward $2,400 and higher resistance zones.
A breakdown below support would place focus on the lower green zone near $1,800. That level represented the next visible support structure on the chart.
Market impact
Ethereum has been under broad bearish pressure again with the current stabilizing phase. The overall structure of the market is still showing weakness from the previous breakdowns. The sharp sell-off below $2,624 had increased liquidation across leveraged positions.
The market momentum slowed down later on as the trading volumes settled near support. The current structure of trading highlights uncertainty between buyers and sellers. Price continues moving in a tight range after the large downside candle.
Short-term traders monitored the $2,400 level for confirmation of renewed bullish momentum. A move above that zone would reopen focus on higher resistance areas.The chart also showed rejection risks if Ethereum failed to hold recovery momentum. Lower highs remained visible across the broader structure.
Support and resistance outlook
Ethereum saw trading activity inside a significant technical area where buyers were trying to make a comeback. Reactions around current support levels were very important in terms of market direction.
Prices have stabilised but continue to fall off long-term resistance. The overall shape remained under pressure despite the strong demand. If it continues to climb above $2,400, it would be a positive development for the short term market. Significant upside momentum above $2,800 could bring focus to higher recovery targets.
If the $2,150 level is not held then there is a greater risk of falling into the next support zone. Traders were still keeping an eye on the volume and the candle formation for confirmation.
FAQs
To which level did the price of Ethereum rise?
Ethereum surged to the aforementioned support level at $2,150 following a significant market drop.
What is the important resistance level for Ethereum?
During the present trend the $2,400 area was the next area of resistance.
What caused the drop in the value of Ethereum?
Ethereum breached the $2,624 level and several other support levels, which further fueled selling pressure.
What happens if Ethereum holds above $2,150?
Holding above $2,150 keeps short-term recovery possibilities active within the current structure.
What is the next downside level below support?
The next visible downside support zone appeared near the $1,800 region on the chart.