
TLDR
- The key $0.081 support zone for Dogecoin, where it has become the focus of longer-term investors, is now being tested.
- Huge rallies have been seen historically in DOGE market cycles following significant consolidation and accumulation.
- Whale accumulation alongside growing ETF inflows has focused attention on the DOGE current chart setup.
Dogecoin is hovering around a vital support zone as traders wonder if the meme coin is about to preserve its multi-year market structure. The asset is currently consolidating around $0.086 as it made slight gains in the last 24 hours while stuck inside the multi-year consolidation that it’s been in since 2021.
DOGE Tests Long-Term Support Within Multi-Year Channel
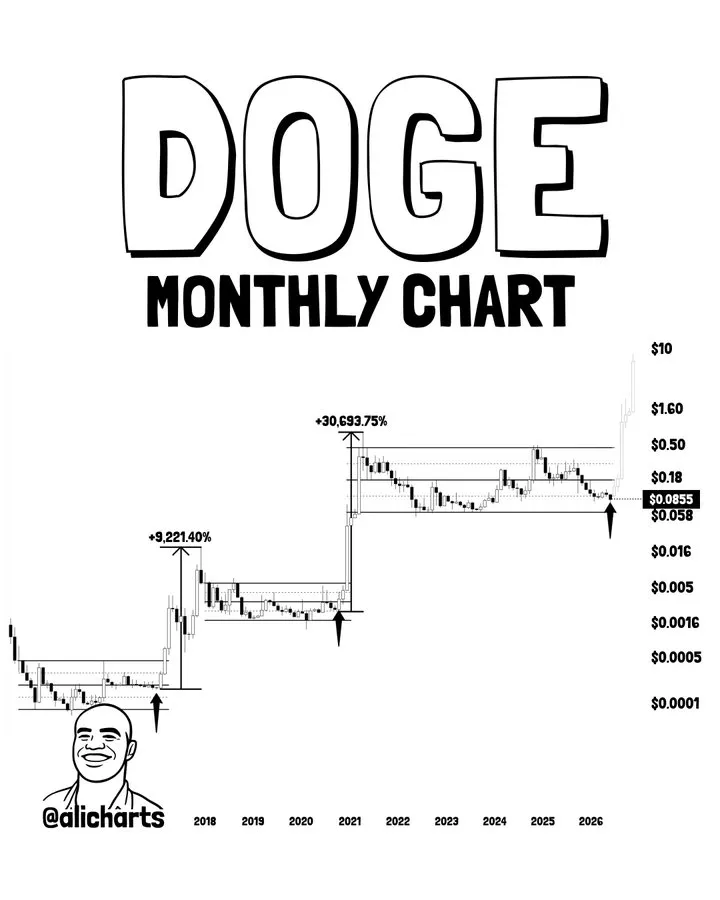
Market analyst Ali Charts presented a monthly chart of Dogecoin exhibiting a cyclical pattern that has appeared since the asset first emerged. Analysis suggests that DOGE typically undergoes prolonged periods of consolidation prior to beginning significant uptrends.
In the tweet, the analyst noted Dogecoin’s current retest of the $0.081 level, which represents the bottom of a five-year parallel channel. The level is an important one for sustained movement, and if upheld, could potentially precede a similar breakout condition to what was observed in prior cycles.
Historical Cycles Show Similar Market Behavior
The chart points out two significant expansion periods. During the cycle of 2017, Dogecoin climbed well over 9,200% after breaking out from an accumulation phase that endured for quite a long period.
Later in the 2020-2021 cycle, DOGE attained price gains of over 30,000%, leading it towards its all-time high near $0.74.
In the current scheme, we have gone through an extended period of correction from the top of 2021. Support near $0.058 has been held on each test, while resistance levels continue to cap the potential upward movement.
Source: Ali charts
Support and Resistance Levels Remain in Focus
Several price levels continue to attract market attention as traders monitor the next directional move.
Key Price Levels for DOGE
| Level | Type | Description |
| $0.058 | Support | Main support zone within the current structure |
| $0.081 | Channel Support | Lower mid-range boundary of the five-year channel |
| $0.18 | Resistance | Former support turned resistance |
| $0.50 | Resistance | Major historical resistance area |
| $1.60 | Target Zone | Long-term expansion target on the chart |
| $10.00 | Projection | Extended cycle projection shown by the analyst |
Looking at the chart, it appears that the $0.058 level remains a critical support region. Any persistent break beneath that area would ultimately damage the overall market structure and would redirect price focus back to prior support areas in historical lows.
Concurrently, resistance continues to remain clumped in between the $0.18 – $0.50 region. Participants are all focused on these price points, as a move over the aforementioned range would fundamentally alter the technical view of the market.
Levels Traders Are Monitoring
- Support at $0.058 remains intact.
- DOGE is trading near $0.081 channel support.
- Resistance stands at $0.18.
- Higher resistance appears near $0.50.
- Long-term targets include $1.60 and higher projections.
Whale Activity and ETF Inflows Add Market Interest
Increased buying pressure and trading activity surround the current support area according to recent market data. Whale holders are believed to have acquired over 200 million DOGE around the $0.081 level, placing greater emphasis on the previously marked zone.
This has come as U.S. Spot Dogecoin ETFs attracted roughly $12.44 million in net inflows. This rise corresponds to rising institutional interest in crypto-related assets.
Market Scenarios Remain Dependent on Key Levels
Traders are still keeping an eye on whether or not DOGE can defend the support or ultimately break the resistance levels. If the price can continue to hold $0.18, the narrative would become bullish, or if it breaks over $0.50, DOGE would return to a very historical resistance area.
For now, Dogecoin still seems to be accumulating within a macro, or longer-term range. As you can see on the chart, the market structure is very similar to past accumulations. Traders are keeping a close eye on the support.
FAQs
1. Why is the $0.081 level important for Dogecoin?
The $0.081 level represents a key support area within Dogecoin’s long-term channel. Holding above it could help maintain the current market structure.
2. What are the main resistance levels for DOGE?
The major resistance levels are $0.18 and $0.50. A breakout above these zones could strengthen bullish momentum.
3. What does the historical cycle analysis suggest?
The analysis suggests that Dogecoin has previously experienced large rallies after extended consolidation periods, leading some traders to watch for a similar pattern.
4. What could invalidate the bullish outlook for DOGE?
A sustained move below the major support level at $0.058 could weaken the current structure and increase downside risk.