Key Insights:
- XRP recorded a decline of over 5% and broke below the $1.40 support level.
- Momentum indicators confirm weakening strength and ongoing bearish pressure.
- Key support zones remain at $1.35, $1.30, and potentially $1.00.
XRP was trading at $1.39 at the time of writing with over a 5% loss. The price chart illustrates price action broke down after being rejected from the $1.50 level, which was a bullish reversal. The daily chart highlighted more selling pressure as the price continued to make lower highs and was struggling to rebound. Next, the price started to range and finally broke the short-term support at $1.40. The candlesticks show that volatility has increased with long upper and lower wicks, which indicates that there were both buyers and sellers in the market today.
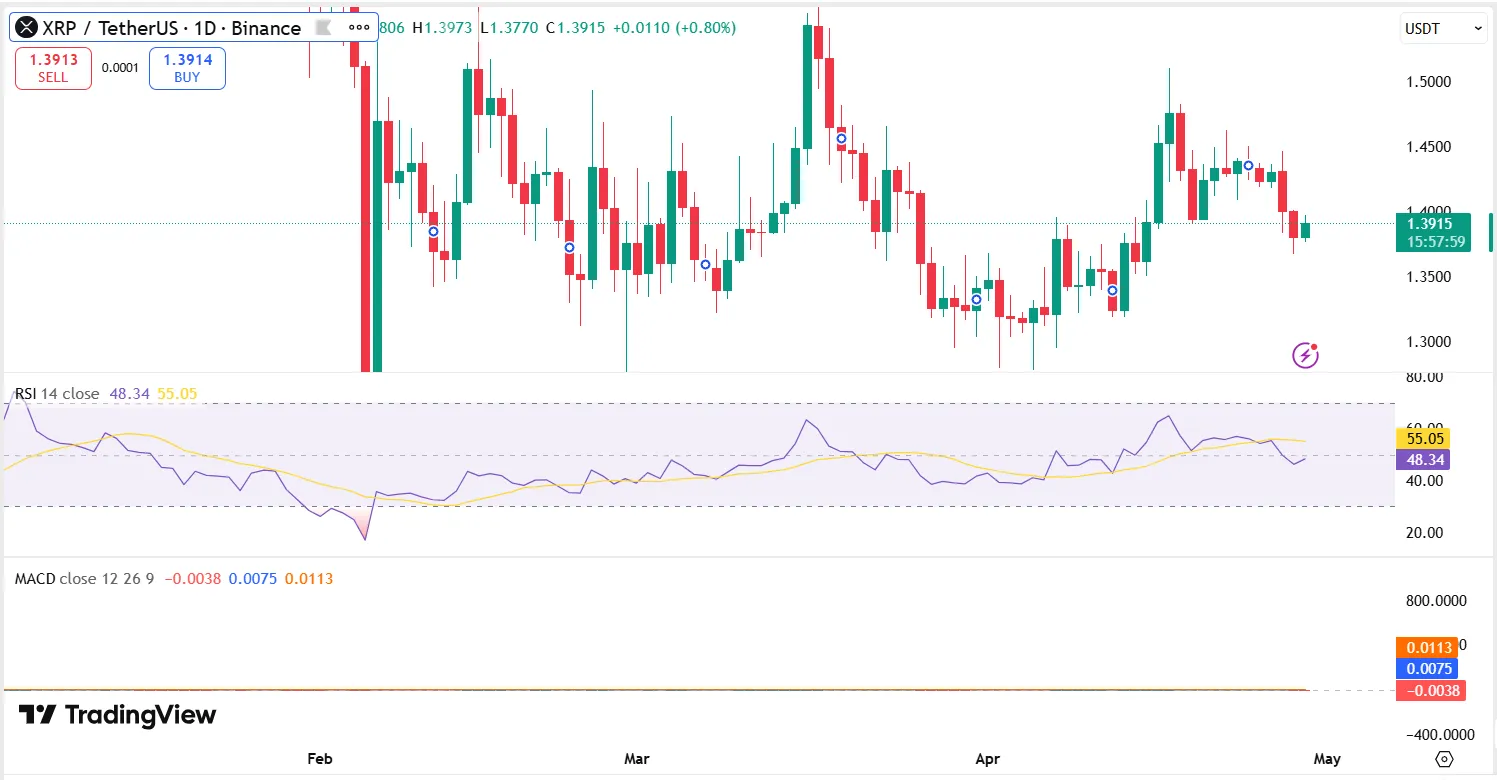
This was supported by oscillators. The Relative Strength Index (RSI) dropped to almost 48 from above 55 (neutral). This suggests less urgency on the part of buyers over the past days. In the meantime, the Moving Average Convergence Divergence (MACD) indicator is negative on the histogram and the MACD line is below the signal line. This combination illustrates there was still bearish momentum in the session.
Why did XRP’s Price Move Below $1.40?
the asset broke below $1.40 owing to weakness above the $1.45 level. The price chart reveals higher level resistance that led to selling on each approach. This led to lower highs, as momentum slowed to the upside. The drop came after consolidation when there was no discernible direction, as buyers were unable to push the price up.
The volume patterns indicate that there was insufficient volume to push up the price, and more negative candles. This helped the drop below support. The RSI’s move down towards the midline and the MACD’s depiction of negative momentum indicated loss of interest in buying and the negative momentum. These indicators provide a glimpse into the action before the move below $1.40.
Bitcoin Dominance’s Impact on XRP
Bitcoin dominance is a key term impacting market capitalization. Asset dominance has a positive correlation with market capitalization: the higher the dominance the higher the market capitalization in Bitcoin, and the lower the market capitalization in altcoins (such as XRP). This results in downward pressure on the prices of altcoins, especially during stagnation or periods of uncertainty.
As seen on the chart, in the time period shown, XRP followed the market to reflect a lack of risk appetite. While Bitcoin remained in slightly better shape, altcoins had difficulty gaining momentum. This prevented XRP from regaining resistance levels, and led to a fall below $1.40.
Potential Support for XRP Between $1.40 and $1
The chart shows multiple areas of support below the current level. The first zone is around $1.35, a level where the price found temporary support. This area provided temporary support prior to the recent surge in price and now provides direct support. The second area is found around $1.30, where price previously accumulated before rising.
In case of further selling pressure, $1.00 is a significant support level both psychologically and historically. It is a level at which buying was strong in the past. The RSI nearing 40 suggests momentum may be approaching oversold levels if the trend continues downwards. However, the MACD is still negative, confirming the bearish trend and suggesting the potential for further downward testing.
Broader market weakness weighs on XRP
The cryptocurrency market has shown less activity in the period depicted in the chart. There were some retracements of recent gains in major assets, and a more cautious trading approach. This affected sentiment, with less buying and more short-term selling.
XRP was not immune to this, and saw some of the same hiccups and weakness. The investor reaction to these stutters and rejection was a profit-taking one, which added to the downward movement. The investors’ caution meant that buying was not strong at support levels, and price was able to fall without much support.
Conclusion
The XRP price was trading at $1.39 intraday after breaking the $1.40 support. Price has shifted from a consolidation to a downtrend following rejection at $1.50. Momentum indicators have weakened and continue to show a downtrend.
Price is finding support at $1.35 and $1.30 and lower at $1.00. Market forces and flow of funds with Bitcoin dominance is affecting XRP. In the graph it has gone from ranging to a downtrend with a sellers’ bias.
FAQs
1. Why did XRP fall below $1.40?
XRP has fallen below $1.40 due to its failures at $1.45 and lack of support.
2. What is XRP’s price?
On the graph XRP is sitting at $1.39.
3. What does the RSI mean?
The RSI is neutral at 48 from a higher level.
4. What does the MACD show?
The MACD is negative with negative histograms and down.
5. Where are the supports?
Support levels appear near $1.35, $1.30, and the major level at $1.00.