Key Insights:
- The same type of correction can be observed in the 2022 and 2026 years in Bitcoin with 2022 and 2026 showing lower highs and range-bound consolidation in the price.
- Increasing BTC flows to exchanges in the context of consolidation is a supply of liquidity and solidifies short-term sell-pressure.
- The middle range category of $76,095 is a very important reaction zone, where it can influence short term support and resistance behavior.
The kind of market structure in Bitcoin shows similarities after multiple cycles and thus it attracts attention to similar price action in the period of 2022-2026. The diagram uses two timelines to follow the movement of prices in the post peak periods of consolidation.
In 2022, Bitcoin fell drastically after almost reaching $32,000 and moved into an extended sideways trend. The price oscillated around approximately $24,400 and $18,700 with lower highs and creating troubled support areas. There were some short-term recoveries, which were limited by resistance levels several times and could not continue on its upward trend. The building indicates that it has compact volatility until it breaks down to lower levels.
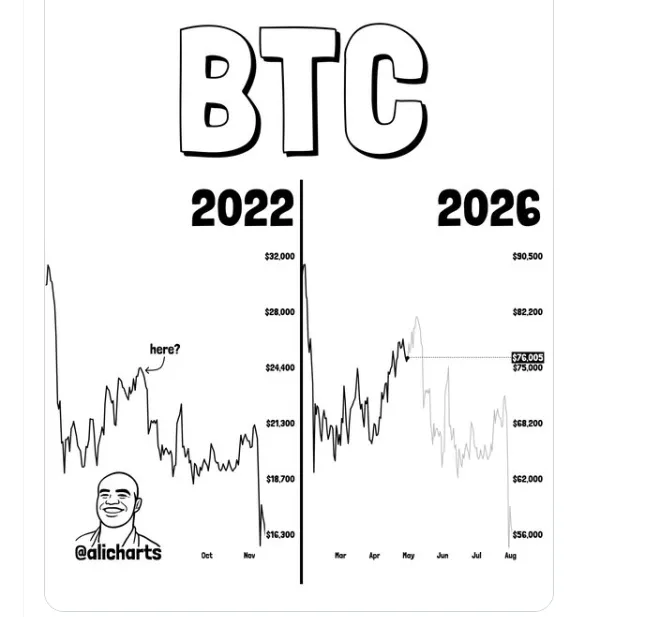
By 2026, Bitcoin was trading at around $90,500 yet it then incurred a corrective phase in which the prices could be seen to be falling below highs. The price re-traced to the $75,000 area, which was temporarily held in the consolidation process. There was a middle ground of about $76,095 as an indicator of a reaction level in the downturn. The greater range of the current correction is price fluctuations in the range of $82,200 to $62,000.
Both eras follow the same order of decline, consolidation, and partial recovery in specific parameters. The 2026 edifice is similar to the first one, with a rebound period then more downwards continuation. The future trend indicates that the trend is going to have an upward bias then a second bending down and adhering to the previous cycle.
This analogy captures volatility compression and range-bound action repeated and a subsequent rise in the pricing trends of Bitcoin.
Inflows to BTC exchange increase when it is in a correction phase.
The inflows of bitcoin to exchanges correspond to the corrective level depicted in the 2026 structure. The drop in prices, starting at $90,500 and approaching $75,000, is accompanied by flooding of the market in the trading sites. These inflows increase the supply of BTC that could be sold in the case of the consolidation.
With Bitcoin trading between the $82,200 and $62,000 price ranges, the depth of the exchanges generally increases when people are the most unsure. This activity indicates that the market participants are putting assets to short-term trades or de-risk. The middle ground around the mark of $76,095 serves as a reaction zone, and inflows might increase.
In the structure of 2022, the same inflation trends were witnessed in the course of the lateral movement followed by lower progression. An increase in exchange supply in both periods of consolidation correlates with the decreasing price stability in both cycles.
Bitcoin bounces back to stabilize around $77K following a steep drop in price.
Bitcoin has been traded on a daily basis and its price is currently close to $77,300 following a rebound since the previous lows.The graph depicts that above $90,000, there is a steep fall after which bears take off with a solid momentum up to the $65,000 point.
Price established a bottom around $64,000, and started to gradually recover with rising lows throughout March and April.The price was driven up to the area of the $78,000, which was resisted by buyers and further price increase was constrained.
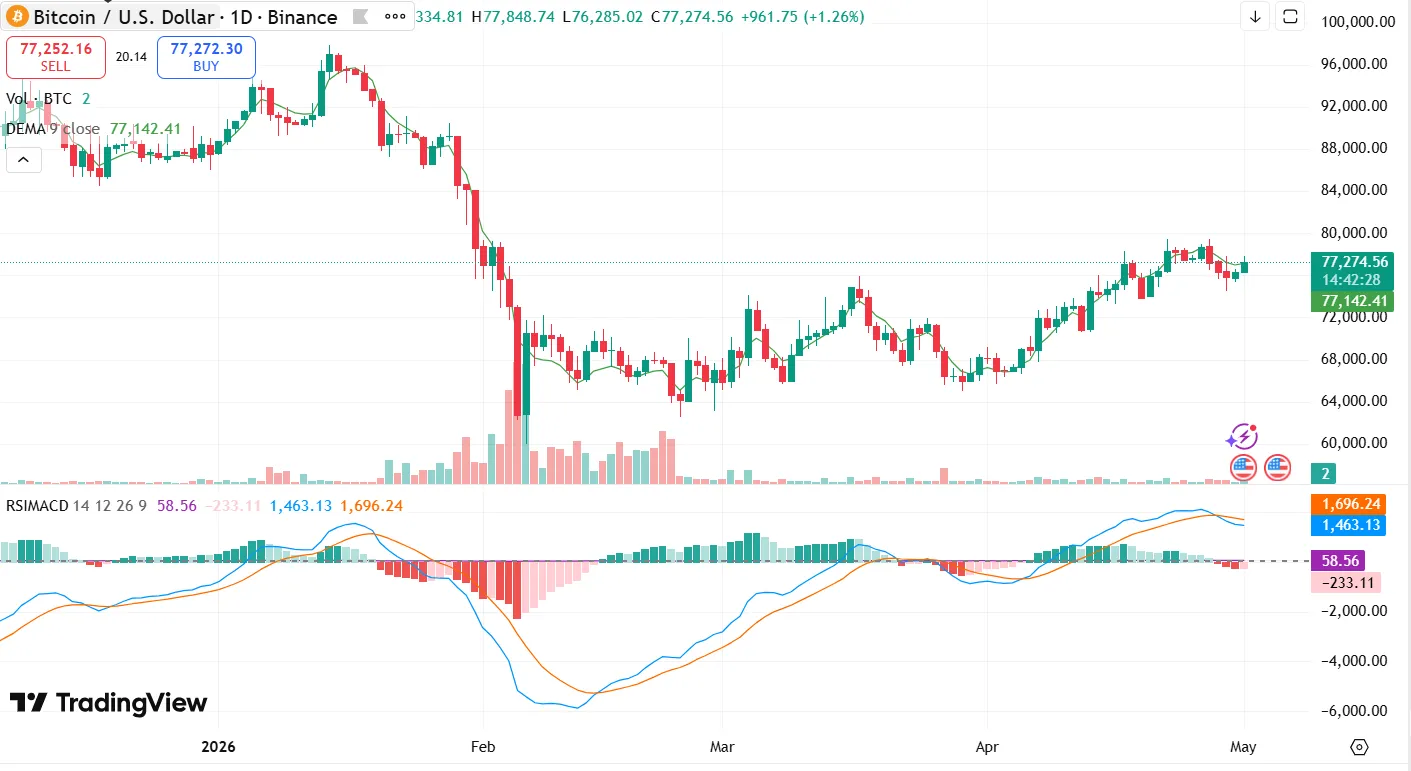
The latest candles indicate that the price had been consolidated between the levels of $75,000 and $78,000, meaning that the price was less volatile around the resistance area.Price is getting closely followed by the moving average, which confirms about the upward momentum in the short term in case of a recovery.
The data given by RSI MACD indicates a good upward momentum, but the histogram bars are otherwise becoming narrower towards their current levels.During the sell-off, volume rose and during the recovery, stabilized.
Market Impact
The repetitive pattern of Bitcoin in 2022 and 2026 indicates how the cryptocurrency endured the pressure exerted on its price stability in the prolonged periods of correction. Decreases in peak levels to set ranges make the markets more uncertain, influencing the short-term market sentiments. As the prices fluctuate in between the resistance and support zones, liquidity accumulates in the exchanges and it is likely that such futures will move more downwards.
The increased inflows of BTC in the process of consolidation increase supply capability that may become further tougher when market demand decreases. This dynamic constrains powerful recovery efforts, with instances of recurring lower highs in both cycles. The fact that mid-range reaction level lies around ($76,095) seems to affirm the role of key support zones in predicting short-term direction.
When historical behavior continues to be exhibited, there may be a further instance of a breakdown phase before the historical behavior endures. This trend affects trader positioning, enhances volatility compression and postpones bullish continuation. The wider market ramification is of a hesitant mood, slower momentum and long time-span of consolidation, before a strong trend is taken.
Conclusion
The price pattern of Bitcoin in both cycles shows a steady pattern of downfall and stability within specific ranges. This action indicates disciplined volatility and recurrent opposition as close to lower highs as possible.
The inflows rate of the exchange at the stages enhances supply and leads to lower price stability. Price action and inflow trends have been moving in the same direction which augers well that as yet there will be more stress before a favourable directional movement can build up.
FAQs
What is the BTC exchange inflows?
They mean that Bitcoin is transferred to exchanges, expanding the supply of potential sales.
What is the reason why Bitcoin is creating smaller tops on corrections?
Lower highs- Selling pressure restricts a recovery effort in a resistance level.
What is the meaning of the level of 76,095?
It serves as the intermediate area of reaction in which the price exhibits the temporary support or resistance.
What is the impact of consolidation on the price movement of Bitcoin?
Concentrating depresses the pace and it frequently is a precursor to a breakout or more decline.
In what way can two structures in 2022 and 2026 be compared?
Both cycles will bear similarities in terms of the falling trend, trending, and even being likely to continue their fall.