
- Chainlink is trading around $8.20 because it was rejected at the resistance area.
- Leverage long positions were leading the market; however, the liquidation was evident in leverage long positions.
- The volume and open interest were below prior high levels.
The analysis of Chainlink Price shows LINK hovering in a tight range following the decline of LINK during the last 24 hours. The analysis of technical indicators, together with the information from the derivatives markets, shows that the current mood of traders is cautious. As of press time, LINK was trading at $8.19, which marked a 1.6% drop from yesterday.
Chainlink Price Analysis Reveals Resistance Above $8.40
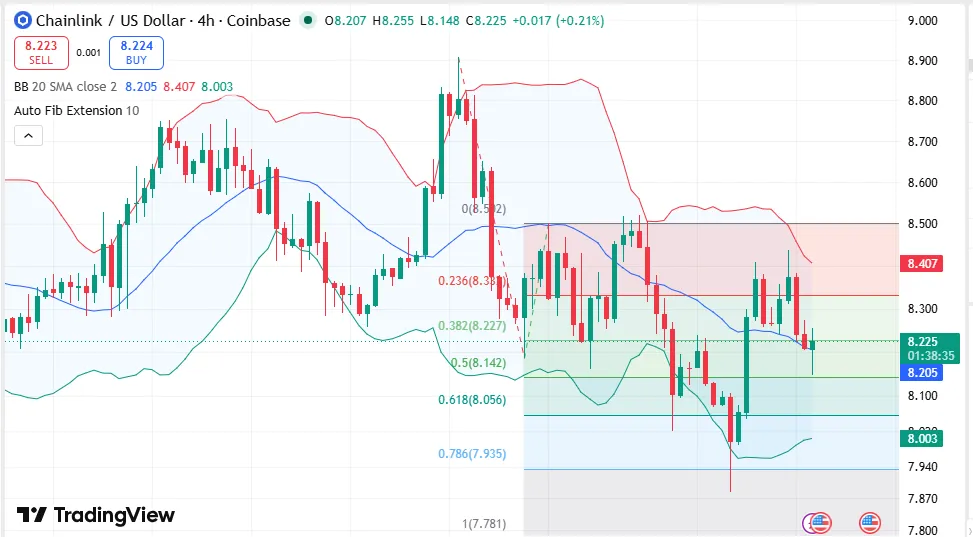
On the four-hour time frame, LINK was trading around $8.21, staying not far from the 20-period SMA of $8.20. In terms of Bollinger Bands, the upper bound was estimated at $8.41 while the lower one was situated at $8.00.
Source: Trading View
In the recent candle formation, the price had failed to sustain gains above the level of resistance at $8.40. This resulted in resumption of selling force that sent LINK back towards the center of its recent range.RSI stood at 47, remaining below the level of neutrality at 50.
Although it does not suggest any signs of overselling, it is indicative of weakening momentum than earlier sessions. With regards to the current technical setup, resistance can be seen at $8.40, whereas the nearest support lies near $8.00.
Critical Technical Levels
- The resistance level is $8.40 and then comes the tougher resistance at $8.52.
- The support level is around $8.14, followed by further levels at $8.06 and $7.94.
- RSI is below the neutral 50 level, signifying poor short-term momentum.
Fibonacci Retracements Identify Crucial Support Levels
Fibonacci retracement levels have identified some other critical technical levels for traders to watch out for.
After rejecting resistance near $8.52, LINK slipped below the 0.382 Fibonacci retracement level at $8.23 and traded around the 0.5 retracement level at $8.14. This placed the token near an important support zone after the recent decline.
Additional downside levels were identified at the 0.618 retracement near $8.06 and the 0.786 retracement around $7.94.On the upside, resistance remained around $8.38, followed by the previous rejection area near $8.52. The latest price pattern showed ongoing oscillations between support and resistance points without a definitive break out in either direction.
Moving Averages Still Show Short-Term Underperformance
Further trend indicators revealed LINK trading below all significant exponential moving averages on the four-hour chart.
The price was lower than the 20 EMA of $8.25, 50 EMA of $8.31, 100 EMA of $8.31, and 200 EMA of $8.24. Lower than all the above mentioned moving averages meant that short-term price performance was below trend levels.
The 200 EMA at around $8.24 continued to remain the nearest resistance level for price. The price was still seen trading just below this level in the last session.
Indicators Still under Stress
- LINK is trading below the 20, 50, 100, and 200 EMAs.
- The 200 EMA at $8.24 still remained the nearest level of resistance.
- Price is yet to show an up move beyond major trend indicators.
Long Biased Derivative Data Despite Liquidations
Long bias remained prominent on leading exchange platforms when it came to derivatives positions.
On Binance, the long-to-short ratio for the LINK/USDT contract was 1.553, whereas the ratio on OKX was higher at 2.63. Meanwhile, on Binance itself, the ratio between long and short trader accounts amounted to 2.0516, while the ratio between positions was 1.6352.
Moreover, according to liquidation statistics, recent losses were mainly sustained by bullish positions. During the previous hour, long liquidations reached about $213,640, while there were no short liquidations recorded. Four-hourly statistics show long liquidations amounting to around $217,890, while short liquidations totaled only $886.
Source: Coinglass
The trend continued even in longer periods of time. In the past 12 hours, long liquidations amounted to about $352,200 while short liquidations to about $28,200. In 24 hours, long liquidations amounted to about $352,830 while short liquidations to about $43,38
Open Interest and Volume Below Previous Highs
The Chainlink Price Analysis is consistent with this theme.
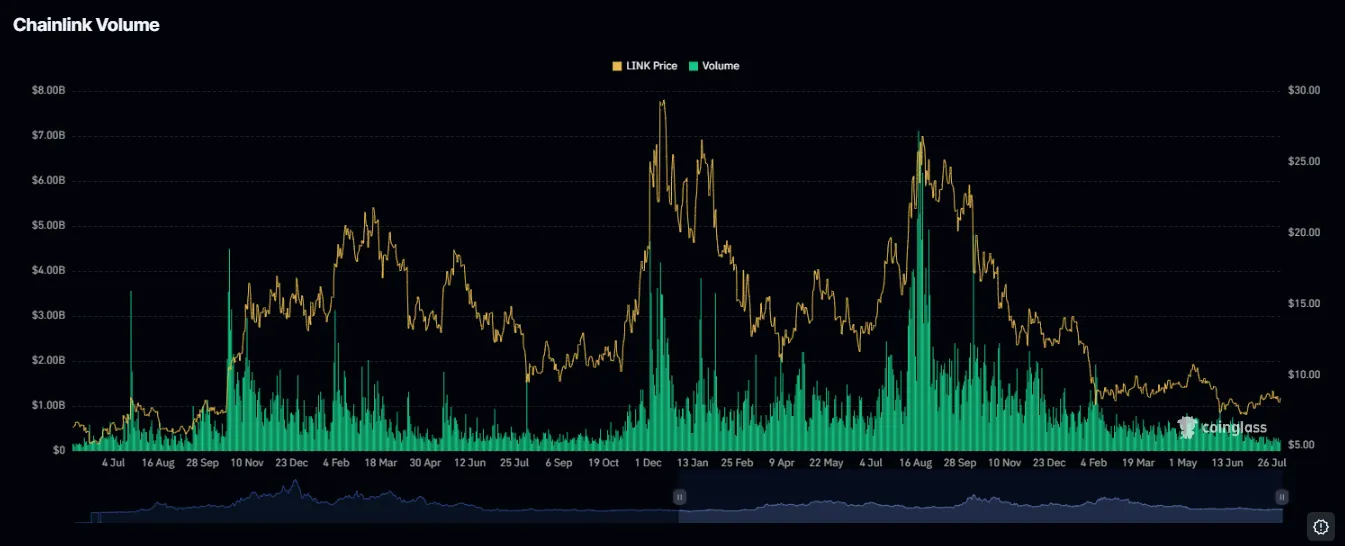
Open interest has declined substantially from earlier highs above $1.8 billion to approximately $400 million to $500 million, while LINK’s price has also moved lower over the same period. Recent readings showed open interest stabilizing near those levels.
Frequently Asked Questions
Why is Chainlink trading near $8.20?
The LINK token is currently trading at approximately $8.20, having fallen by 1.6% within the last 24 hours but within a defined support and resistance level.
What are the major support levels for LINK?
Fibonacci support retracement levels in four-hour charts include $8.14, $8.06, and $7.94.
Where Chainlink resistances lie?
The main resistance is at $8.40 and the secondary resistance is at $8.52 after the recent rejection.