Key Insights:
- The pressure on resistance still prevails: Solana has failed to break through the $88-$90 zone again and again, which emphasizes the high selling pressure, puts a limit on the short-term momentum, and supports the range-bound structure.
- Ambivalent market signals lead to uncertainty: Price action is negative in the short run, but the growing open interest, positive funding rates, and whale action are indicators of underlying accumulation and are a possibility of a reversal.
- Direction will be determined by critical levels: The $86.5 level is an immediate pivot that will serve as a help the level above now goes on to test 88-90 and a failure will open up the support zone of $82-83.
The intraday price movement of Solana depicts a strong shift between the initial strength and the long-term selling pressure where the asset started trading at around $87.7 and rising to the intraday high at around $88.21. The positive trend however did not last long as the price turned downwards and moved downwards during the session. According to the latest data, Solana is trading around $86.1, which is a significant decline in the trading window. This gradual decline indicates the declining support of buyers and growing bearish dominance, which speaks of a prudent intraday mood of market participants.
Solana Analysis
The 4-hour chart shows Solana trading around the $85.8 mark, which is an indicator of a period of consolidation after the failure to reach the $89-$90 resistance range. That recent pullback indicates that the bullish momentum has been deteriorating with the price finding it difficult to maintain itself above short-term moving averages of about $86.5. It shows that in the short run, the buyers are losing control and the market is shifting towards a more neutral- to-bearish position.
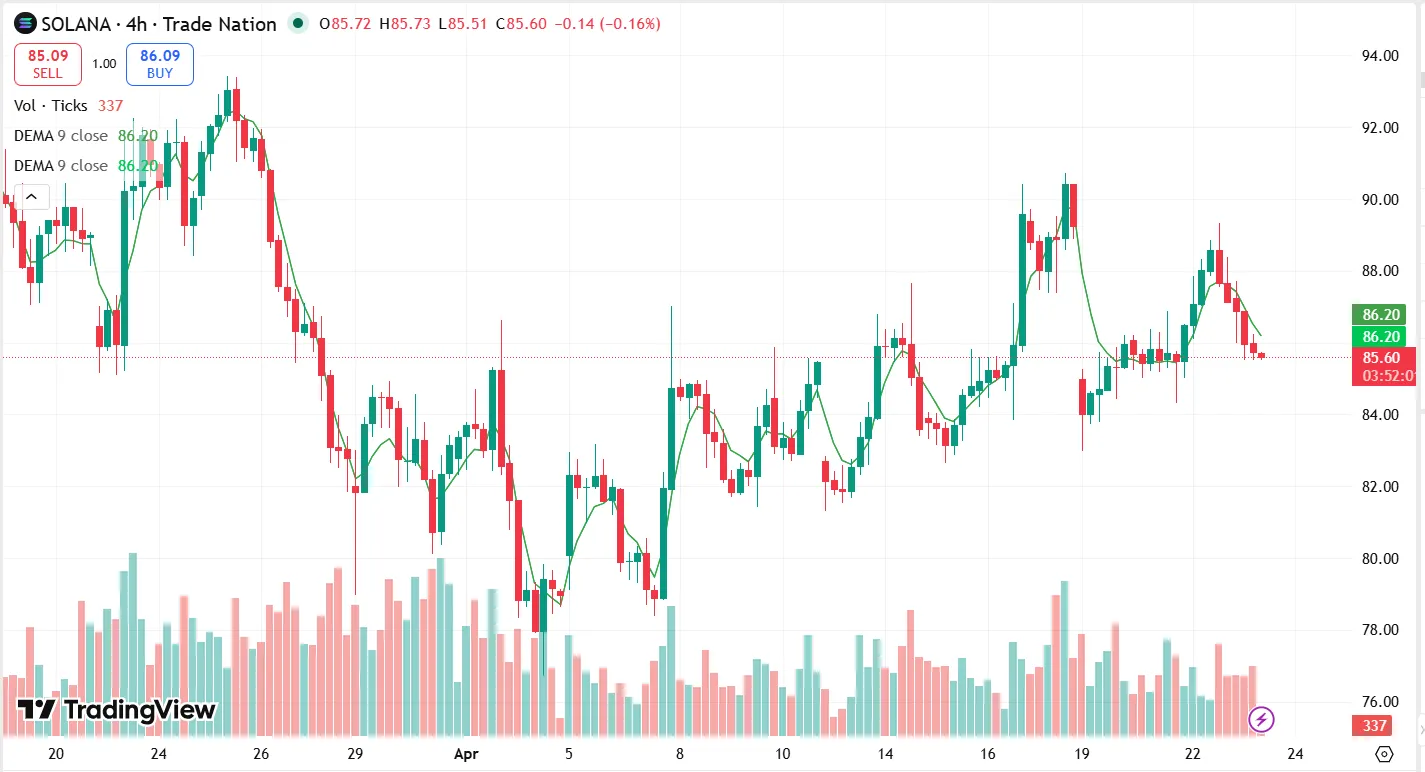
Price action depicts a characteristic of range, and the immediate support will be between $82-$83. This area has already been a high demand region, and thus it has not suffered the additional decline. On the positive side, the resistance is still strong at the range of between $88 and $90, and various rejections depict high selling pressure. The level of volume is rather moderate, which means that neither side of the market is highly convinced.
In case Solana is able to recapture the $86.5 mark and build momentum, we may then have a retest of the $88-$90 resistance range. But loss of positions can result in a further decline to the $82 support which will support a negative short term view.
Solana Signals Bullish Regardless of Short-Term Price Decrease.
In the 24 hours, Solana (SOL) is down more than 1%, and it trades near to $85.6, sliding down intraday highs of around $88.2, according to the chart. The temporary drop notwithstanding, the bigger market indicators are an indication of the underlying strength. CryptoQuant statistics show an optimistic future, with the metrics on chains showing more activity of whales in spot markets and a cool environment, which is generally a configuration that indicates accumulation periods and not distribution.
Sentiment also is positive in derivatives markets. Funding rates have been reversed and have gone to $0.0016, indicating that long traders are paying shorts, a phenomenon usually preceding a positive price change. Moreover, open interest in futures has increased to $5.15 billion, a sign of increasing engagement and revitalized retail interest. This open interest and buy-side dominance trend combination means that, although the price is weak at the moment, Solana may be setting the stage to potentially rebound in the near future.
Market Impact
The melding of weak intraday price action and strong on-chain and derivatives data generates a mixed yet strategically significant prospect of Solana. The fall in the short-term to the mid-$85 level is indicative of wary mood, as traders would tend to pull out of the market when there is rejection of the resistance and a waning momentum. This could hold SOL range-bound between $82 and $90 until a directional catalyst is evident.
The bullish signs beneath the market, though, such as the growing open interest, positive funding rates, and the growing whale activity, indicate that some larger market participants are setting up to make an upside move. In case the buying pressure is in line with such indicators, Solana may experience a breakout with the resistance zone of $88-$90. On the other hand, this optimism cannot be translated into price strength, failure of which can result in a long period of consolidation, in which no meaningful recovery will be experienced in the near future.
Conclusion
Solana is at a crossroads, with a weak price in the short term, but bullish on-chain and derivatives data. With the asset still below the critical levels of resistance since it failed to maintain above $88, statistics like the growing open interest, the good funding rates, and the growing whale activity can be seen as a possible accumulation and a potential upsurge. The subsequent path will heavily rely on the ability of SOL to regain and maintain above the level of $86.5 which may open the door to the level of $88-$90 of resistance. Nevertheless, the lack of support can extend the time of consolidation or cause the retest of the range of $82, which keeps the short-term perspective in a precautiously neutral tone.
FAQs
1. What is causing the fall in the price of Solana in the short term?
The main cause of Solana falling during the day is that it was rejected at the 88-90 resistance zone, resulting in decreased bullish momentum and growth in selling pressure.
2. What are the support and resistance levels of SOL?
The first strong resistance is between 82 and 83 with the second strong resistance between 88 and 90 where price has been rejected multiple times.
3. Does Solana continue to exhibit bullish behavior with the decline?
Yes. On-chain data indicates that there is an increased activity of whales, positive rates of funds, and an increase in the futures open interest, all of which indicate a possible accumulation.
4. What does an increase in open interest mean to Solana?
The increased open interest of approximately 5.15 billion today is an indication of increased market participation and this is likely to be traders getting prepared to either an upward or a downward movement, usually the bullish side in conjunction with positive funding rates.
5. What would verify a bullish breakout of Solana?
A continuation of the upward movement above 86.5 then a breach above the 88-90 resistance band would indicate a fresh wave of bullish energy and this will lead to additional rise.