On-chain analytics are now commonly used to understand how cryptocurrencies perform in the market by examining blockchain transactions, rather than relying solely on price trends.
The method entails examining data on network activities, such as balances, transactional data, and market interactions. The data is accessible as the blockchain is open-source and unalterable. As a result, on-chain analysis provides a direct view of capital movement and network usage, offering insights grounded in verifiable data rather than price-based assumptions.
How On-Chain Analysis Is Different from Conventional Analysis Techniques
On-chain analysis differs from technical analysis in how it uses data. Unlike technical analysis, which relies on past price movement data, on-chain analysis examines blockchain data to gain deeper insights into coin movements and user actions.
For instance:
- Movements of large sums of coins to exchanges mean the possibility of selling.
- The movement of the tokens out of exchanges means buying or holding.
- Movements indicate the actual positions of the coins.
The above facts have been derived from the blockchain data and, therefore, are measurable and traceable.
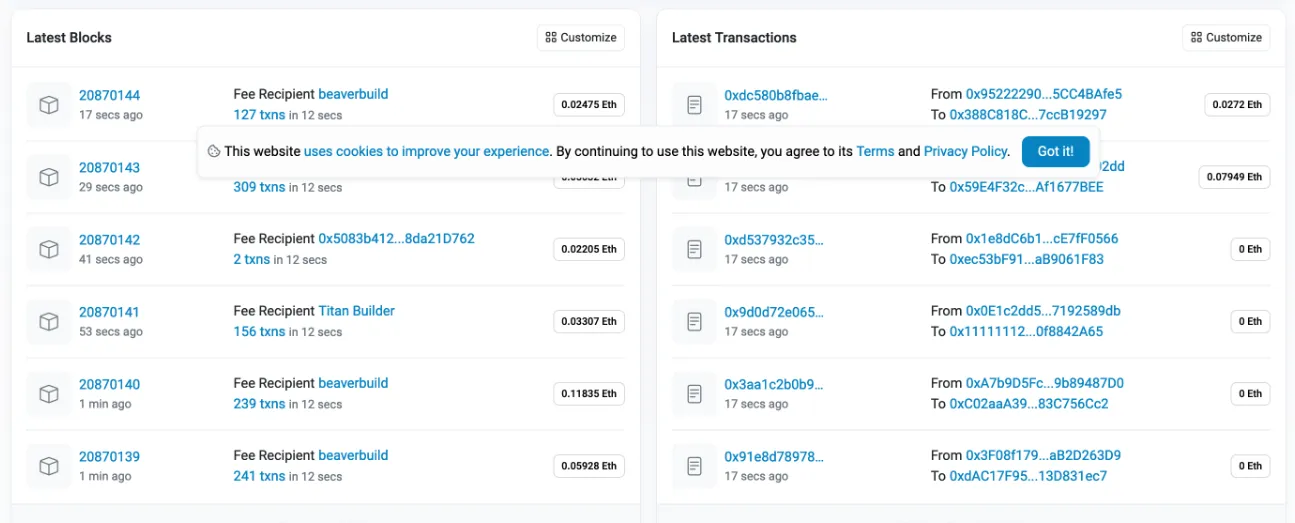
Source: Etherscan
Most Common Metrics Used in On-Chain Analytics
Here are some of the common metrics used when analyzing on-chain movements:
Crypto Flow from and into Exchanges
Inflow implies cryptocurrency deposits at an exchange. Increased inflows usually coincide with elevated sell-offs. Outflows refer to crypto withdrawals from an exchange and are associated with hodling practices.
Active Wallets
This metric refers to the number of wallets that participate in network transactions. A higher count of active wallets means there is increased activity within the network.
Whale Moves
These are major players in the crypto market and can influence its market dynamics. It is therefore essential to keep track of whales’ moves.
Supply Distribution
It represents the distribution of tokens in different wallets. The concentration of tokens in a few wallets can enhance the volatility.
NVT Ratio
Network Value to Transactions ratio is an indicator measuring the value of the network relative to the amount of transactions in it. It helps determine the correlation between valuation and blockchain metrics.
On-Chain Analysis Tools
Several tools enable access to blockchain data as follows:
- Blockchain explorers monitor transaction activity in different wallets
- Glassnode offers information about the flow of funds to exchanges and blockchain activity
- CryptoQuant provides information about exchange balances and large holder movements
- Santiment uses blockchain metrics and sentiment analysis
- Dune Analytics allows creating dashboards and querying data
Using multiple tools helps verify the same patterns across different data sources, thereby increasing accuracy.
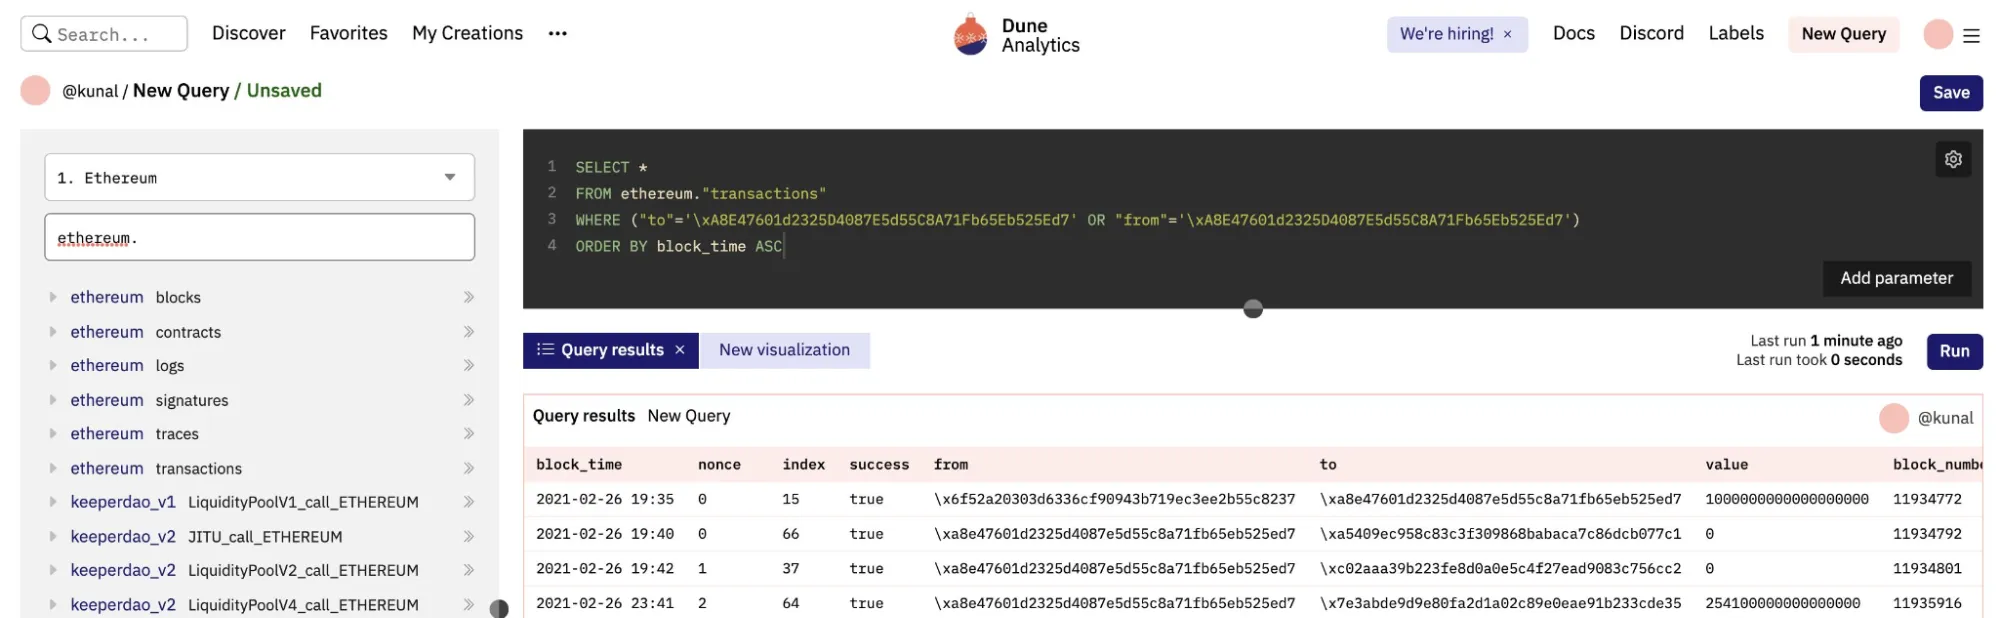
Source: Dune Analytics
How On-Chain Analysis Is Applied in Practice
On-chain analysis can be seen in action through recent market events.
At the beginning of 2026, there was an influx of bitcoins in exchanges despite their price approaching a level of resistance. This indicated that the market’s major players were preparing for sales. As expected, a price drop soon followed. Big wallets were accumulating funds, which was then followed by a price bounce back.
Moreover, during the rally in altcoins, there was an uptick in active addresses across several blockchain networks.
Common Errors in On-Chain Analysis
On-chain analysis is based on factual data, but interpreting the results requires care.
- Using only one factor may not give an accurate perspective.
- Whales’ activities do not necessarily reflect selling pressure.
- Temporary surges may distort the signal.
Conclusion
On-chain analysis provides an objective means of assessing cryptocurrency markets by leveraging blockchain data already recorded in the system. The analysis uses transaction and wallet activity, as well as network participation, to obtain information objectively.
FAQ
What is on-chain analysis?
It is the analysis of blockchain transactions to gain insights into market behavior and trends.
Is on-chain analysis better than technical analysis?
No, both analyses bring their own strengths to bear on making educated investment decisions.
Does on-chain analysis forecast future prices?
No, but it uncovers trends that may impact prices in the future.