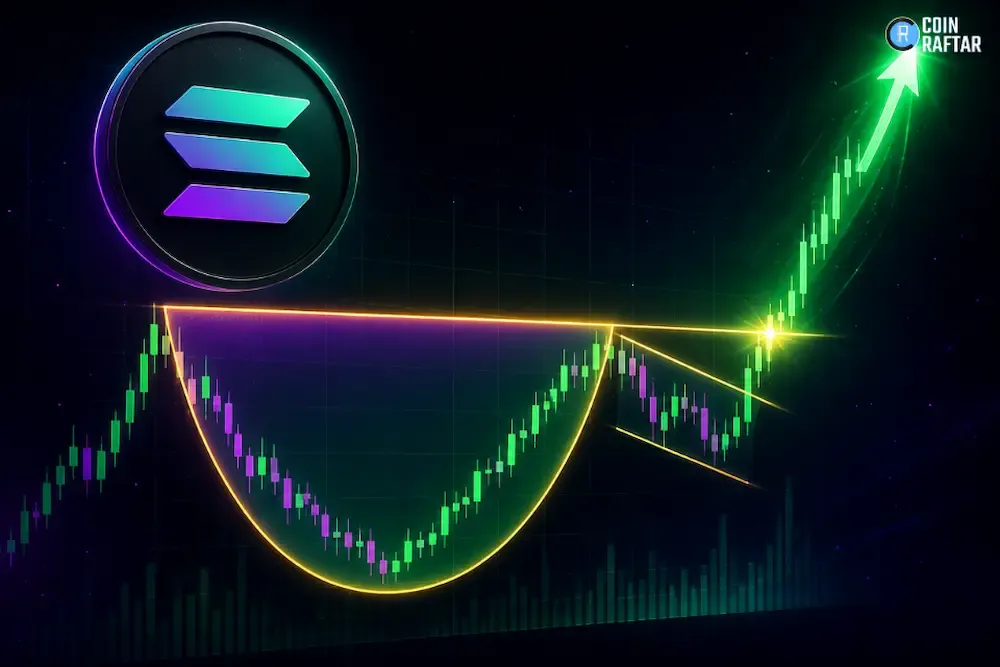
Key Insights:
- Solana is trading near $93.14, with charts showing support pressure and breakout interest.
- The second chart shows SOL near $90.867 after falling 3.76% during the session.
- Traders are watching the $115 resistance zone and the $80 to $85 support area.
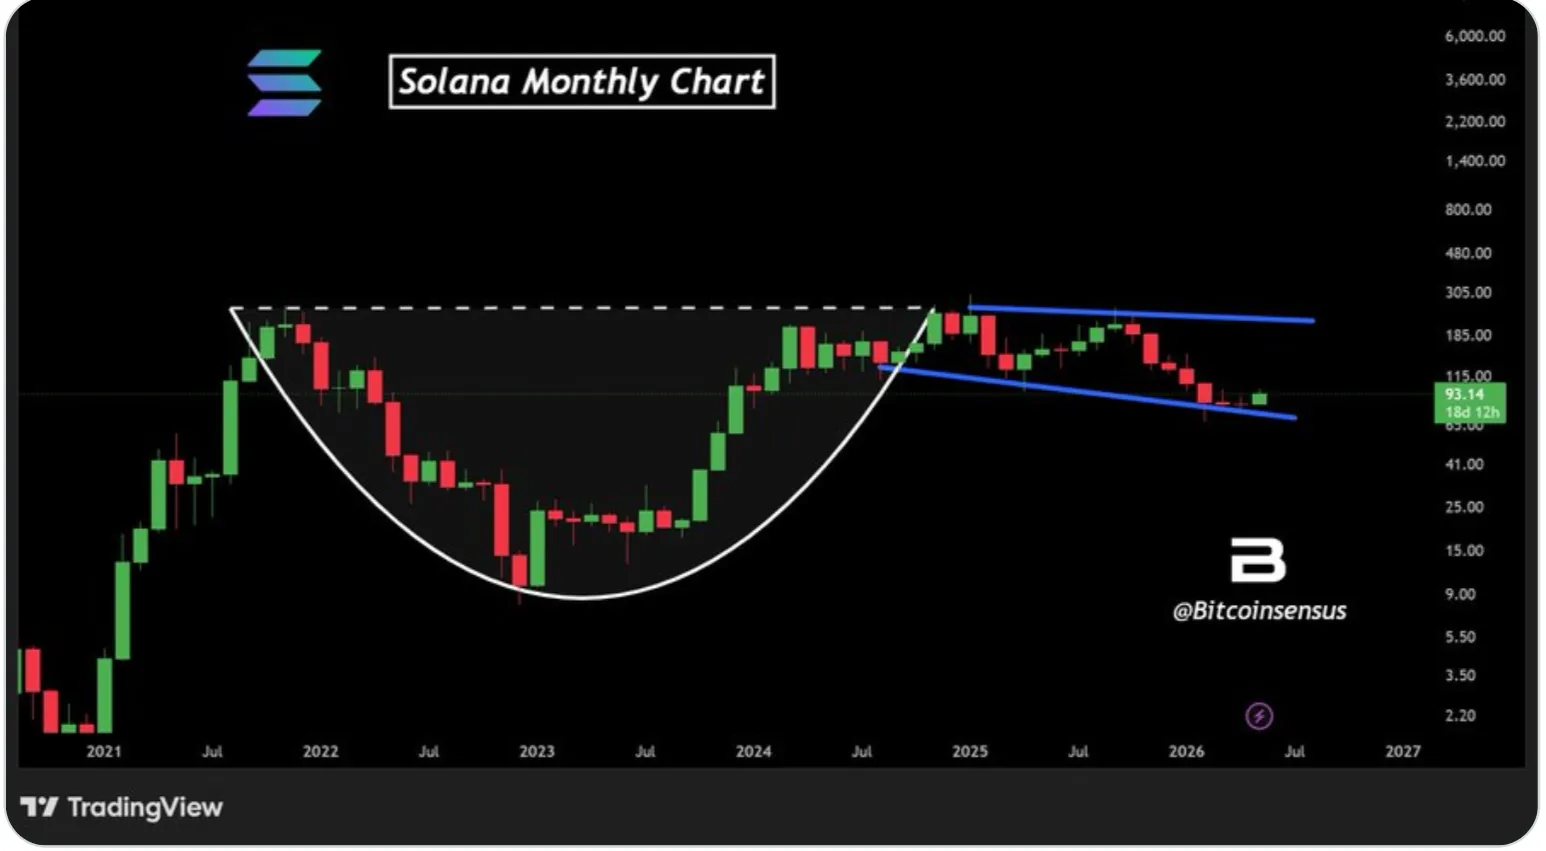
Solana is drawing fresh attention after pressure near major support. The monthly chart placed SOL near $93.14, with about 18 days and 12 hours left in the candle. Another chart showed SOL at $90.867 after a 3.76% drop, with sellers still active.
The setup shows the price trading near a decisive technical area. Buyers appear focused on defending the lower range, while traders continue watching resistance near $115. A breakout above that zone could improve sentiment after months of sideways movement and failed recovery attempts.
Solana chart shows breakout pressure near support
The analysis tends to show the price moving inside a narrowing structure after the previous cycle peak. The upper trendline slopes lower, while the lower line continues holding near current trading levels. The chart indicates that the market is likely to be in a state of indecision, with a possible shift in direction soon to come.
It evidence of a rounded bottom that occurred between 2022 and 2024.That structure followed a sharp decline from earlier highs and later helped price recover strongly. However, the latest candle shows buyers still need strength before confirming another major move.
Monthly structure will keep buyers focused on resistance.
The current trading zone is around $93.14 with a more significant resistance level around $115. If that level does get broken, analysts expect it to draw more momentum traders and short-term trading interest within the cryptocurrency market.
Once this zone is broken above, the next major level of support was found around the $185 mark. In addition, traders are closely watching the $305 level as one of the key resistance level zones to consider for a longer-term move higher, a price zone that has been one of the most frequently referenced areas of bulls on the longer horizon recently.
Other technicals also emerged during the last pullback/recovery action throughout the SOL market structure. Market data revealed SOL opening at approximately $94.417 and making a slight move up to the $96.386 intraday price mark during the trading day.
But the downtrend was picked up later to drive the price down to the $90.240 support level at the close. The shared trading figures recently showed SOL dropping around $3.563, or almost 3.76%, in a downtrend on the day to close at about $90.867.
It was a downturn from current short-term selling activity while overall conditions were improving on the longer term technical charts. Some traders pointed out that the ability to hold the price above the recent lows may be important for continuing the higher-biased market trend moving forward.
Market impact depends on the next close
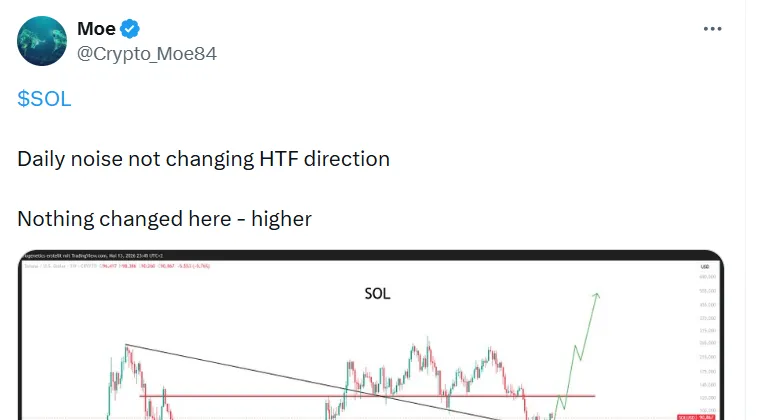
The support zone between $80 and $85 remains important for the current structure. If it could be recovered in a clean hold above this area, the recovery setup would remain viable. A breakdown below it, however, would cause a dampening of confidence and put the market at risk of even more downward pressure.
The projected path on the chart suggests a possible recovery toward $120 before stronger upside. That level matches the horizontal resistance area already visible on the chart. If buyers reclaim it, market sentiment could shift from defensive trading toward renewed accumulation.
Outlook stays cautious until confirmation arrives soon
The larger timeframe also displays a possible bullish pattern, although it lacks confirmation. Traders might want to find any resistance level to be broken and increase the volume with higher closes. If it is not confirmed, the chart will remain a developing chart and not a breakout.
The end result is that SOL is at a significant technical level following some weak trading activity. The key is for Price to hold the lower price level and retest $115 to firm up the bull market. So far investors are still on their guard and there are no doubts about the recovery or break-down risks remaining in the market.
FAQs
What price is SOL trading near on the chart?
The monthly chart shows SOL near $93.14, while the second chart shows $90.867. These figures place price near an important support region.
Why is the $115 level important for traders?
The $115 area appears as a key resistance zone on both chart structures. A move above it could support stronger bullish momentum.
What support zone should traders watch now?
The $80 to $85 area remains the main support region visible on the chart. Losing it could weaken the recovery setup.
Does the chart confirm a breakout already?
The chart does not confirm a breakout yet because price remains below resistance. Buyers still need a strong close above key levels.
What could happen if buyers reclaim resistance?
A reclaim of resistance could open a move toward higher zones near $185 and $305. The projected path also points much higher.