
- ADA traded above critical support levels but remained below significant moving averages amid an effort to gain momentum.
- Van Rossum’s hard fork was successful, and no action had to be taken by holders and operators of ADA.
- Longs outstripped the number of shorts but open interest did not exceed previous peaks due to resistance.
Cardano price forecast still depends much on a set of technical indicators, derivatives positioning, and Cardano’s protocol update. The ADA coin was trading around $0.1626 on July 20 amid the continuation of the recent pullback, while technical indicators were still signaling short-term weakness amid signs of stabilization.
On the other hand, Cardano has successfully performed the activation of the Van Rossum hard fork with full network participation, which became an important protocol update without any issues.
Cardano Price Forecast Fails to Gain Momentum Despite Intraday Upside
The ADA coin is trading at $0.1626, which is lower by 1.31% compared to its value during the previous day. The opening session for the coin was rather stable but soon the price of ADA declined to the $0.161 level. The buyers tried to bounce back but did not manage to reach previous levels.
The trade volume went up by 22.53% to $222.01 million, showing that the market was more active during the downward movement. The increase in volume was due to testing for support near the region without having any successful recovery.
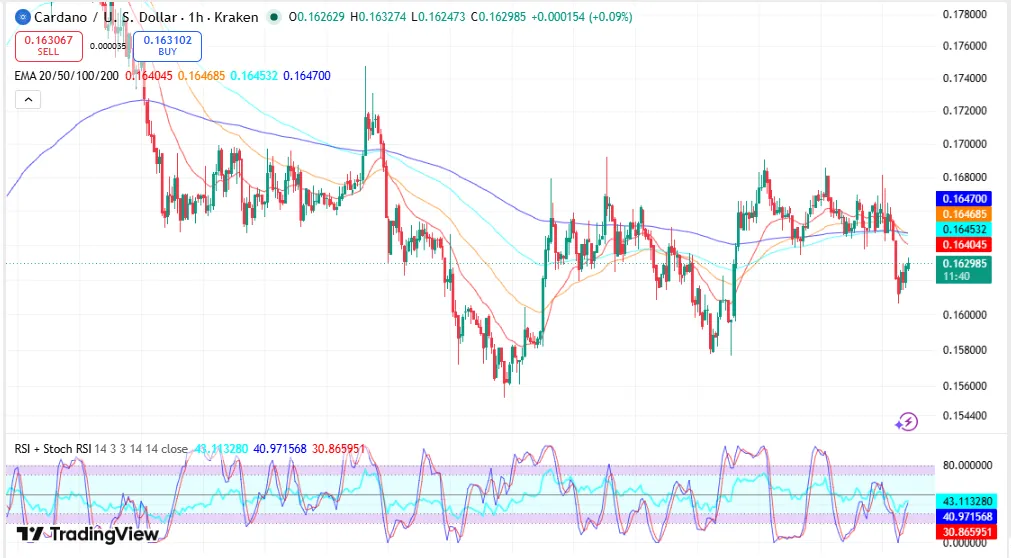
On the 1-hour TradingView chart, the price of ADA was seen at $0.1627, trading below the 20, 50, 100, and 200 exponential moving averages (EMA).
The Fibonacci retracement levels pointed out the nearest level of resistance from $0.1647 to $0.1650.
Source: Trading View
Key resistance levels
- $0.1647–$0.1650 remains the first resistance zone.
- $0.1681 represents the next breakout level.
- $0.1827–$0.1885 forms a broader resistance cluster from the Parabolic SAR and Bollinger Band.
Important support zones
- Initial support sits near $0.1615.
- Stronger technical support is located around $0.1604.
- A loss of support could expose ADA to $0.1556.
A move above the immediate resistance zone would improve the short-term technical structure, while failure to defend support could expose ADA to lower price levels.
Bollinger Bands and SAR Continue to Define the Trend
Additional indicators continued to point toward a cautious technical outlook.
ADA slipped below the Bollinger Band midline at $0.1687 after testing the 50-day EMA during the previous session. In addition, Parabolic SAR, which is placed at $0.1827, was still higher than the price level, forming a bearish trend indication.
The upper Bollinger Band, which is set at $0.1885, when combined with Parabolic SAR, forms a resistance area between $0.1827 and $0.1885. Price was unable to form any breakthrough through this area in the month of July.
There is a descending trend line, which has been drawn from January 2026 highs and this trend line also continues to provide resistance to prices.
Furthermore, the lower Bollinger Band, which is placed at $0.1488, is aligned with the support area which has been providing support since June.
Cardano Hard Fork Succeeds Without Network Downtime
Despite the fact that the price remained weak, Cardano successfully implemented one of its most important updates to the protocol.
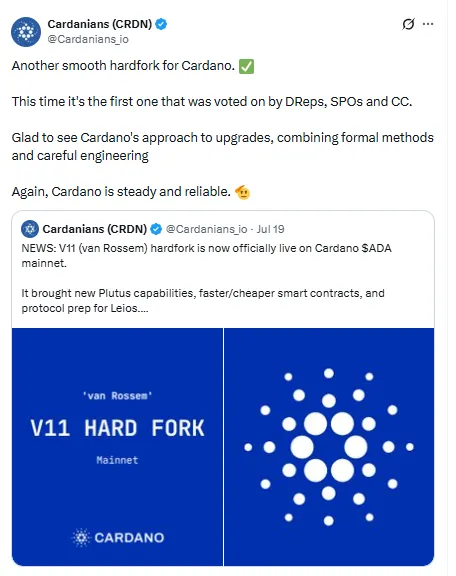
The Van Rossum hard fork was launched on July 19, 2026, when 93% of the blocks on the Cardano network had already been created by nodes running protocol version 11 before the activation of the update.
Source: Cardanians
The governance decision also ended up receiving unanimous backing from:
- Delegated Representatives (D-Reps)
- Operators of stake pools
- Constitutional Committee
This process did not involve any ADA holders and was functioning as expected during the upgrade. While the launch involved a number of technical upgrades for the network, the successful hard fork itself did not create any connection with the performance on the market.
Cardano Price Forecast Considers Bulls’ Favorable Posture Along With Low Open Interest
The derivatives’ data remained bullish for Cardano price forecast.
The Binance ADA/USDT longs vs shorts ratio was 2.34 and that on OKX was 3.14, showing that there were more long positions than short positions on both exchanges.
However, the long/short position ratio for Binance top trader remained 0.93. Liquidation data showed long traders absorbing most of the recent market pressure.
| Metric | Value |
| Long liquidations | $546,110 |
| Short liquidations | $96,430 |
| Binance long/short ratio | 2.34 |
| OKX long/short ratio | 3.14 |
Derivatives highlights
- Long positions continue to exceed short positions on major exchanges.
- Long liquidations significantly outpaced short liquidations over 24 hours.
- Top trader positioning remained more balanced than the broader market.
However, the open interest position on Cardano has decreased greatly compared to its past levels above $1.8 billion to be at around $400 million to $500 million now. It means that there is lesser speculative participation compared to other times in the market. There was some rise in the open interest recently; however, one needs to see sustained growth along with the strength in prices.
Momentum Indicators Serve as Balance to Technical Weakness
While all technical aspects look weak overall, the shorter-term momentum indicators have shown signs of stability.
The latest 1-hour chart revealed RSI at around 42.7, implying that the market is in neutral to bearish territory rather than being oversold.At the same time, the Stochastic RSI turned upward from oversold territory, suggesting improving short-term momentum.
Separately, analyst LuckSide Crypto identified a bullish crossover on the daily Stochastic RSI on July 20. According to the analyst, the previous two occurrences of the same signal preceded gains of approximately 27% during early June and 40% during late June from their respective lows.
Momentum signals to watch
- RSI remains below the neutral midpoint at 42.7.
- Stochastic RSI has crossed upward from oversold territory.
- Historical crossover signals previously preceded gains of 27% and 40%.
The recent crossover is happening right after the hard fork event of Van Rossum, which provides a technical indication opposite to the historical pattern of Cardano’s price going down after each hard fork event.
FAQs
What is the next resistance level for Cardano?
The next resistance level is in the range of $0.1647 – $0.1650, while an extra resistance can be found at $0.1681.
What is the next support level for ADA?
The next support level is in the range of $0.1615 – $0.1604, where the breakout will bring the price to $0.1556.
What happened during the Van Rossum hard fork?
The Van Rossum hard fork was initiated on July 19, 2026, when 93% of the network blocks were already running protocol v11-ready software.