
- Bitcoin price fell below $77,000 after annual US producer inflation reached 5.4% in August.
- September rate hike odds have climbed to 69.8%, adding pressure across risk markets.
- Bitcoin must hold $76,300 and reclaim $78,000 to keep the $80,000 target open.
The crypto market extended its weakness on Thursday as macroeconomic factors continue to affect the sector. The total market capitalization has dropped by over 3% to $2.60 trillion, while the trading volume surged to $88 billion, indicating increased market activity.
The broader market correction has seen Bitcoin drop toward the $76,000 region. As of this writing, BTC price was trading around $77,312, down by 1.50% on the daily chart. Its market cap and trading volume stand at around $1.55 trillion and $32 billion, respectively.
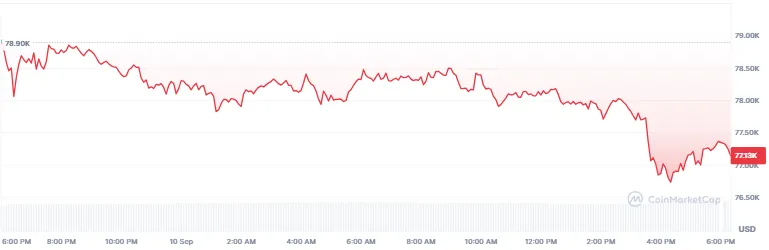
BTC Price Chart: CoinMarketCap
Bitcoin Price Falls Below $77,000 as US PPI Reaches 5.4%
Bitcoin fell below $77,000 on Thursday after US producer inflation data unsettled risk markets. The move erased earlier stability and pushed the cryptocurrency toward its latest intraday low. Treasury yields and US stock futures also weakened after the release.
The Labor Department reported a 0.4% monthly increase in August’s Producer Price Index, matching economists’ forecast. Annual producer inflation reached 5.4%, above July’s 4.8% pace and the 5.3% market estimate.
https://x.com/coinbureau/status/2098014875859443766
Bitcoin reacted quickly as derivatives traders reduced leveraged exposure following the release. According to data from Coinglass, more than $100 million in leveraged longs were liquidated within 20 minutes. Forced closures added pressure as prices moved through crowded downside levels.
Energy costs drove much of the monthly PPI increase, keeping inflation pressures elevated before next week’s Federal Reserve meeting. Traders now await Friday’s Consumer Price Index, the final major inflation reading before policymakers meet next week.
Hotter Producer Prices Raise September Rate Hike Expectations
Markets sharply increased expectations for a Federal Reserve rate hike next week after fresh inflation data unsettled traders. CME FedWatch has placed the probability of a 25-basis-point increase at 69.8% during Thursday trading. That outcome would move the federal funds target range to 3.75%-4.00%.
A week earlier, markets gave unchanged rates a 50.6% chance, showing how quickly expectations shifted. Thursday’s pricing left only a 30.2% probability that policymakers would hold rates steady. Traders also placed the likelihood of another increase in December near 60%.
https://x.com/Interest_Rates/status/2098054973426680216
August wholesale prices strengthened the case for tighter policy, while U.S. crude climbed above $100 per barrel. Together, those developments revived concerns that inflation could stay persistent through year-end. Moreover, recent hawkish signals from Fed Chair Kevin Warsh have added weight to next week’s decision.
The Federal Open Market Committee meets September 15-16 and will announce its decision on the second day. Higher rates could pressure Bitcoin by lifting Treasury yields and strengthening the dollar against risk assets. Meanwhile, a decision to hold rates could ease immediate pressure across cryptocurrency markets.
Can Bitcoin Price Hit $80,000 This Week?
Bitcoin has dropped more than $3,000 from Monday’s peak. The four-hour chart shows price testing an ascending support line near $76,300. Crypto analyst Wealthmanagerr has recently noted that weak macro conditions continue pressuring Bitcoin and other risk assets.
However, momentum offers an early counter-signal. The price has formed a higher low, while the 14-period RSI printed a lower low. That hidden bullish divergence could support a recovery if buyers defend $76,300. RSI sits near 29.92, below its 42.39 average, confirming stretched short-term selling.
https://x.com/Wealthmanager/status/2098041298431148426
A rebound must first reclaim $78,000 before Bitcoin can retest $80,000 in the coming sessions. Holding the rising trendline keeps that route open. However, a four-hour close below $76,300 invalidates the divergence and would decisively shift the short-term chart’s structure lower.
Bitcoin Technical Analysis: BTC Falls Below Key Support as RSI Weakens
Bitcoin price is hovering above $77,300 on the four-hour chart, extending losses from the September 3 peak. The latest candle reached $76,684 before buyers lifted the price above the low.
Bitcoin now trades below the key support at the lower Bollinger Band around $77,554, signaling selling pressure. Meanwhile, the 20-period middle band at $78,608 forms the nearest recovery level. Resistance follows near the upper band at $79,663.
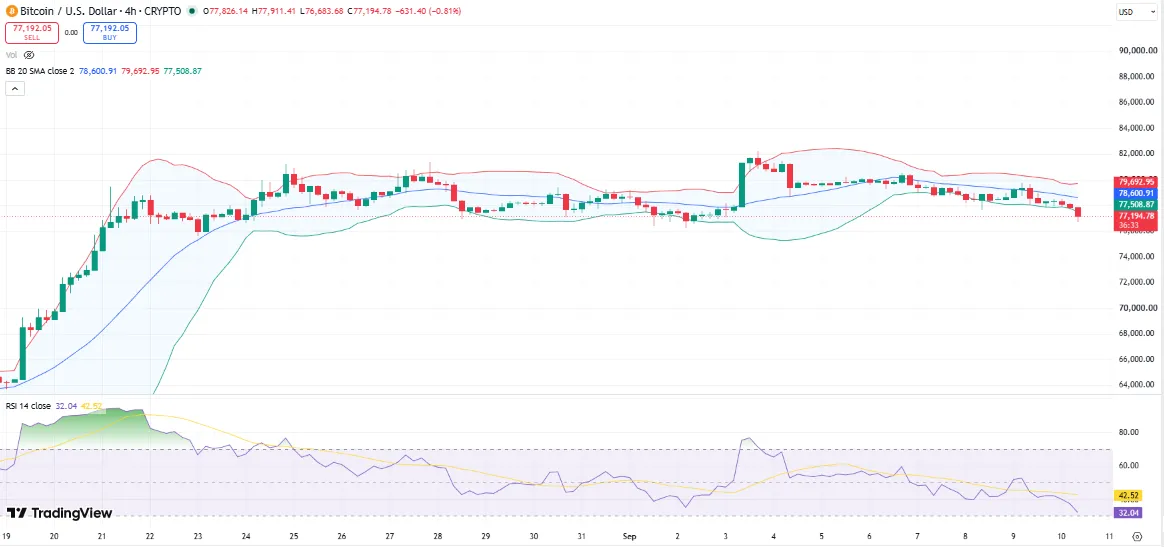 BTC Price Chart: TradingView
The 14-day Relative Strength Index stands at 33.15. The momentum now sits near oversold territory, although the indicator has not crossed 30. A move above $77,554 could ease pressure, while $76,684 marks immediate support.