

- Solana price moves close to $100 on growing ETF inflows and technicals that indicate overbought condition for today.
- Solana price moves to $98.20 on rising ETF inflows and trading volume rising by 83.5% in recent action.
- Solana price hits $100 resistance on bear flag formation and target at $113 if SOL crosses $102 now.
The Solana crypto asset is now trading in the region of the $100 level, having increased significantly over the week owing to spot ETF inflows and increasing trading volumes.
In addition, the trading volume has risen by 83.5% to $7.75 billion. The latest rise in price follows gains from $76.25 and has placed SOL near a key resistance level.
Solana Price Faces $100 Resistance
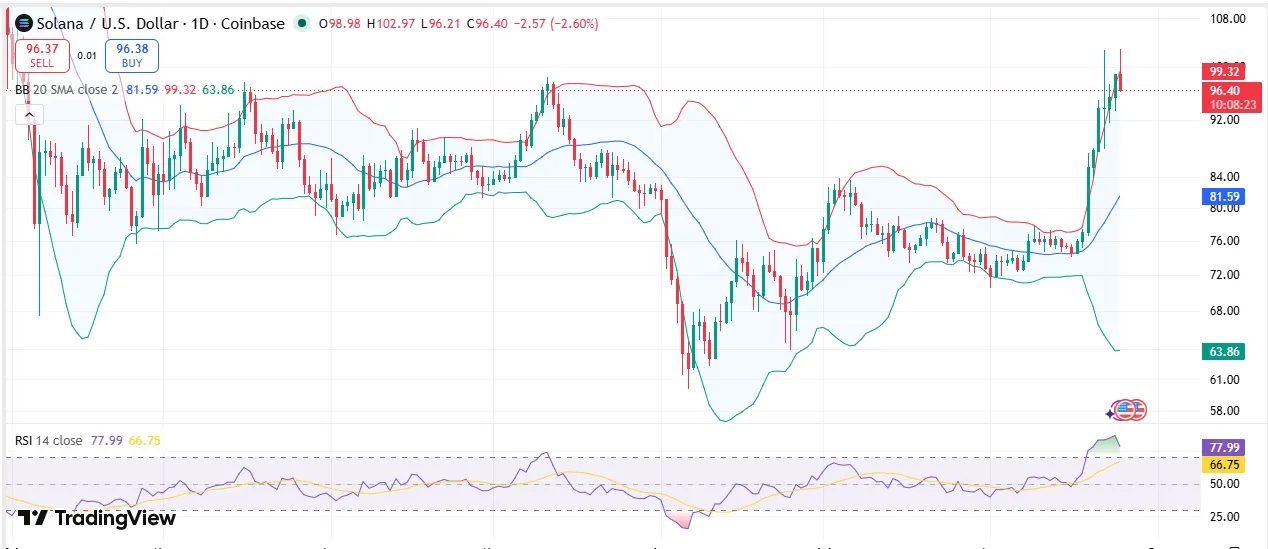
TradingView data for the Solana-to-U.S.-dollar daily pair on Coinbase shows SOL at $97.71, down 1.27% on the day. The pair opened at $98.98 and reached a session high of $102.97 before trading lower. Another TradingView reading puts the pair at $97.90, down 1.08%, after it also tested $102.97.
The daily chart shows SOL trading close to the upper Bollinger Band at $99.61. The 20-day Simple Moving Average stands at $81.65, while the lower Bollinger Band is positioned at $63.70. The Relative Strength Indicator is at 82.06, with the index above the standard level of overbought.
Source: Trading View
The price of SOL has breached several Exponential Moving Averages.The 200 EMA stands at $89.38, followed by the 20 EMA at $84.77, the 100 EMA at $80.04 and the 50 EMA at $79.92.
Fibonacci extension levels identify $100.28 as the 3.618 extension and $104.76 as the 4.236 extension. Earlier extension levels at $93.04 and $85.80 represent the 2.618 and 1.618 levels, respectively.
Solana Price Gains Support From ETF Flows
ETF activity has increased alongside the latest move in SOL. Teddy Fusaro reported on X that the Bitwise Solana Staking ETF recorded $108 million in trading volume on August 24. He described the session as the highest-volume day for any SOL ETF in history.
Bitwise CEO Hunter Horsley also reported that the Bitwise ETF had continued to attract inflows during a period when Solana declined from $225 to $60. According to Horsley, the fund accumulated nearly $1 billion in inflows during that decline.
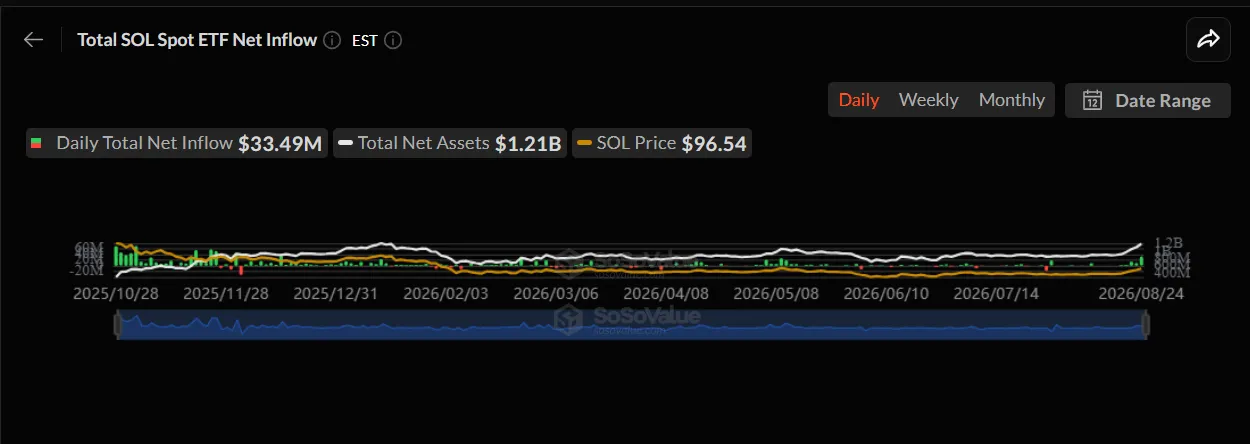
SoSoValue data shows the Bitwise ETF recorded $24.99 million in inflows on August 24. The figure represents its highest single-day inflow since February 2026.
Across the nine spot SOL ETFs trading in the United States, total inflows reached $33.49 million on August 24. That was the highest single-day inflow total since December 2025.
Source: Sosovaue
The total net assets held by Solana ETFs have also increased to $1.21 billion. The figure represents a 68% increase from the $717 million recorded in June 2026.
Bull Flag Sets Potential $113 Target
SOL has gained 32% since August 19, with the advance forming a bull flag pattern on the one-hour chart. The pattern developed as SOL moved toward the $100 level after trading at lower prices earlier in August.
The bull flag has a measured height of 10%. A close above the pattern’s resistance at $102 would indicate a potential move toward $113 based on the stated pattern measurement.
At the same time, SOL is testing the bull flag’s support near $99. A close below that support would invalidate the bullish setup described by the pattern.
The current price action places $100.28 and $104.76 among the stated Fibonacci resistance levels, while $93.04 and $85.80 remain the identified lower extension levels.
FAQs
What is the current Solana price?
SOL is trading at $98.20, according to the provided market data, with a weekly gain of 28.78%.
What is the key resistance for SOL?
The $100 level is the immediate psychological resistance, while Fibonacci extensions identify $100.28 and $104.76 as additional resistance levels.
How much did Solana ETFs receive on August 24?
The nine U.S. spot SOL ETFs recorded total inflows of $33.49 million, while the Bitwise ETF recorded $24.99 million.
What is the potential bull flag target?
The stated bull flag setup points to $113 if SOL closes above the pattern’s $102 resistance.
What are the key technical indicators?
The RSI is 82.06, while SOL is trading above its 20-day SMA and its 20, 50, 100 and 200 EMAs.