
- Prices for Dogecoin remained below the critical moving averages as well as within a tight consolidation range for the week.
- Fibonacci support at $0.06896 levels as well as resistance levels were acting as barriers for the upside move for the day.
- August performance for the coin indicated that there have been a total of eight negative closes for the month in thirteen years.
Dogecoin price continues to be focused on how successfully DOGE is able to hold support above the $0.0689 level with low momentum ahead of the month of August.
Recent market data has indicated that the meme crypto was trading below some important moving averages while consolidating in a tight range. Moreover, the derivatives positioning remained on the long side despite recent liquidations as August historically has been the weakest month for Dogecoin.
Dogecoin Price Forecast Suggests Consolidation Below Important Moving Averages
Dogecoin was trading at $0.0698, indicating a 0.26% fall from the previous day.The session began with selling pressure before a brief recovery carried the price above $0.0700. The rebound faded later, leaving DOGE near its opening level. Market capitalization stood at $10.84 billion, while 24-hour trading volume reached $519.06 million.
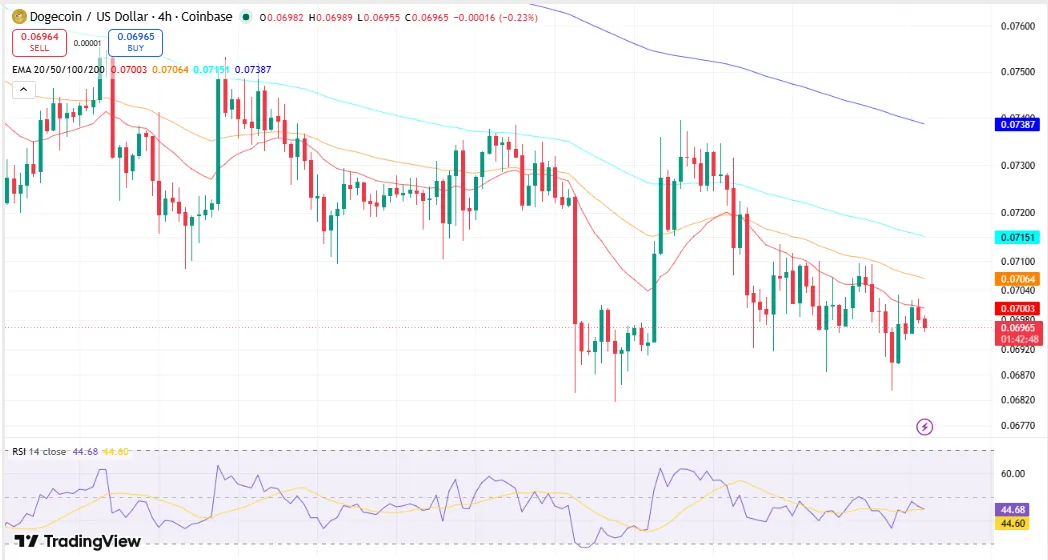
In the four-hour timeframe, the Dogecoin price traded under all the four trends levels, including 20, 50, 100, and 200 exponential moving averages. The 20 EMA was at $0.07005, while the 100 EMA level was at $0.07151.
Source: Trading View
In addition, the momentum indicators suggested low buying pressure. In particular, the RSI stood at 45.83, which was below the neutral 50 and still not in the oversold level. Price action had been range-bound after its previous decline.
Important Technical Signals
- During the period under review, DOGE was trading below the 20, 50, 100, and 200 EMAs.
- RSI remained below the neutral value of 50, suggesting lack of strong momentum.
- Fibonacci Levels and Bollinger Bands Show Near Support Zones.
Moreover, other indicators suggested that Dogecoin was trading above the significant Fibonacci level after having moved away from the resistance level of $0.0739.
The price remained above the 0.382 Fibonacci retracement at $0.06896, while immediate resistance appeared near $0.0708. A higher resistance level remained positioned at $0.07396. At levels below the present prices, a support line was found at the 0.5 Fibonacci levels at $0.06835 and then the 0.618 retracement at $0.06774.
The Bollinger Bands charted also revealed little expansion in the price range. Dogecoin was trading at around the 20-period midline of $0.0700 with the upper band at $0.0709 and the lower band at $0.0691. This shrinking gap between the bands implied that volatility was decreasing compared to previous sessions.
Derivative Long Position Persistence Even with Liquidations
Long positions have been maintained by traders as shown by derivative statistics.
On Binance and OKX, long to short account ratios of over 2.8 were recorded during the period, meaning that long positions were more than short positions.
However, in the last 24 hours, total liquidations amounted to $2.13 million. Long positions accounted for $1.75 million, while short liquidations totaled $382,400. During the previous 12 hours, liquidations amounted to $78.38 thousand, including $76.64 thousand from long positions.
Separate market positioning data also showed Dogecoin open interest remained well below previous cycle highs. Earlier peaks exceeded $5 billion, whereas current open interest stabilized near $1 billion, reflecting lower leveraged participation compared with prior periods.
Derivatives snapshot
- Binance and OKX continued showing long-heavy positioning.
- Most 24-hour liquidations affected long traders rather than short positions.
Resistance and Support Levels Define the Current Trading Range
Several technical levels continue defining Dogecoin’s current structure.
The first resistance point is at $0.07180. It is associated with the Bollinger midline as well as a group of short-term moving averages.
Further resistances exist at $0.07479, $0.07679, $0.08458, and $0.09400, the last one being related to a previous horizontal trading range. Support starts from $0.06881, followed by $0.06700.
Price levels to monitor
- Resistance extends from $0.07180 to $0.09400.
- Initial support remains at $0.06881, followed by $0.06700 and $0.05750.
Historical monthly performance also places attention on the calendar. The data for thirteen years indicates that there were a total of eight months of negative closing in August, having median returns of -5.17%.
The data includes individual losses of -37.4%, -30%, -17.9%, -16.9%, and -12.5%. Positive August results include 204.8%, 60.1%,The average monthly return measured -0.56%, reflecting the influence of the unusually large gain recorded during one August period.
FAQs
What is the nearest resistance for Dogecoin?
The nearest resistance is at $0.07180, with other resistances found at $0.07479, $0.07679, $0.08458, and $0.09400.
What support levels should one consider in DOGE?
Support starts at $0.06881 and follows with $0.06700 and $0.05750 based on the technical analysis.
What historical performance does DOGE show in August?
For thirteen years of data, August has returned -5.17% with eight months of negative closing returns