

- Ethereum price maintained above major moving averages while buyers were able to hold off the support at $1,860.
- Bullish sentiment in the social market resumed, though the same timeframes in the past have been accompanied by a price bounce.
- Ethereum open interest remained near $27 billion as the price remained below the significant resistance at $1,955.
Despite having recently dipped below $1,880, Ethereum price has been hovering around the $1,880 mark, with mixed signals from technical indicators, derivatives positioning and social sentiment. The asset rebounded from the higher moving averages on the 4-hour chart, but it hasn’t succeeded in breaking the resistance level in the wider timeframe.
Ethereum Price Maintains Position Above Major Technical Levels
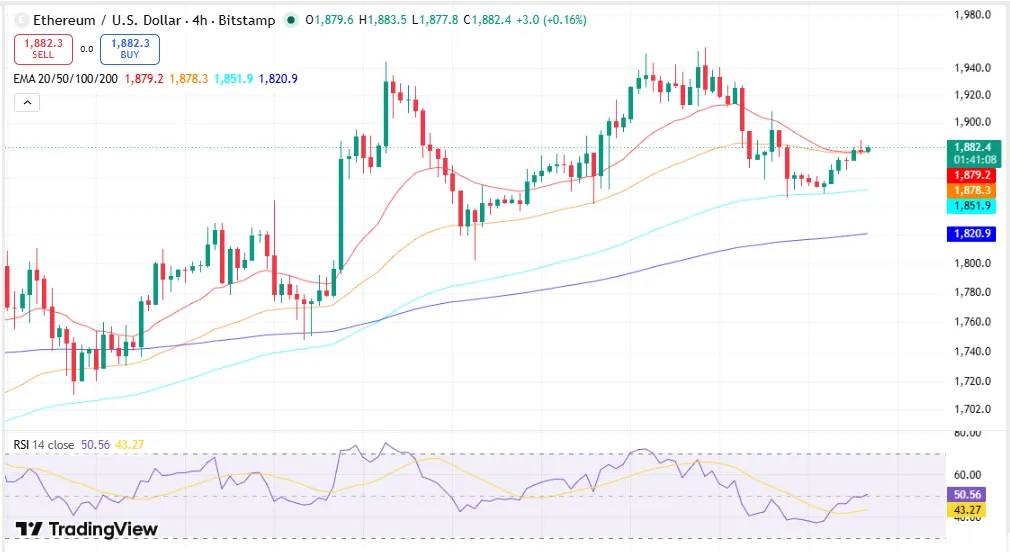
Ethereum price was trading at $1,879.97, marking a 1.2% increase over the last 24 hours after its price had increased steadily from around $1,856. Price action during the recovery was a series of higher highs and higher lows, suggesting that more buyers were still in the market throughout the recovery.
On the four-hour timeframe, Ethereum continued trading above all four major exponential moving averages. The 20 EMA at $1,879 and 50 EMA at $1,878 provided immediate support while the 100 EMA at $1,851 and 200 EMA at $1,820 were lower and held the rest of the technical structure.
Source: Trading View
Key technical observations
- Ethereum’s price breached above all four key EMAs and has remained there since.
- Immediate support is between $1,846 and $1,860 following the recent bounce.
- Price continues to remain below the $1,910-$1,955 resistance area, despite recent rallies.
Ethereum Price Faces Resistance Between $1,910 and $1,955
Ethereum broke out of a series of resistance levels that capped its gains, but it is still moving below $1,860.The asset managed to bounce off the $1,860 level, but has yet to clear a few resistance levels that prevented it from making significant progress.
The 4-hour chart indicated that ETH appears to be recovering from a pullback from the $1,940 to $1,945 price zone where sellers took the stage. The next resistance level was in the $1,910 to $1,945 range.Another technical resistance was close to $1,955.
Support continued to hold around $1,846, an area where buyers previously entered the market during recent declines.
A sustained move above $1,880 kept the recent recovery intact, although Ethereum had yet to break through the resistance range that would extend the latest advance.
Ethereum technical snapshot
| Metric | Latest Reading |
| Ethereum Price | $1,879.97 |
| 24-Hour Change | +1.2% |
| Market Capitalization | $226.88 billion |
| 24-Hour Volume | $4.17 billion |
| Key Support | $1,846-$1,860 |
| Key Resistance | $1,910-$1,955 |
| RSI | 50.09 |
| Open Interest | Approximately $27 billion |
Momentum Indicators Show Balanced Conditions
Momentum indicators reflected stabilization following Ethereum’s earlier pullback.
The Relative Strength Index (RSI) was trading at 50.09 and the signal line was at 42.75. The reading suggested momentum was improving but was still close to the middle meaning markets were balanced.
The Moving Average Convergence Divergence (MACD) was also in positive territory. The MACD line is trading at 37.88 which is marginally above the signal line at 37.84. The flattening histogram however suggested that buying momentum had slowed down from the first recovery.
Bearish Social Sentiment Contrasts With Stable Open Interest
Santiment reported that Ethereum’s positive-to-negative social commentary ratio turned bearish for the third time during the past month.
The data tracked discussions across X, Reddit, Telegram, and other cryptocurrency communities alongside Ethereum’s market performance.
Previous periods of declining sentiment produced different outcomes. On June 27, bearish commentary preceded a 14% increase in Ethereum’s price during the following seven days. Another decline in sentiment on July 11 was followed by a 7% gain over the next four days.
The latest reading showed sentiment falling to one of its weakest levels while Ethereum traded near $1,856 after pulling back from recent highs.
Santiment noted that negative sentiment alone does not predict an immediate recovery, although previous periods of widespread pessimism coincided with later rebounds while ETF inflows, Layer-2 activity, and protocol development remained active.
At the same time, derivatives positioning remained relatively stable. The open interest in Ethereum was restored to about $27 billion following a previous peak of over $60 billion.
Current open interest level for ETH was stable at the lower price, indicating traders’ interest in holding on to their positions.
Market highlights
- Sentiment was registering for the third time on the bear side in one month.
- Ethereum open interest has seen a leveling off from previous declines, holding around $27 billion.
- The recovery has been technical though with a lag in the most recent period.
FAQs
What’s causing the price of Ethereum to remain above the key support?
Ethereum was trading higher than its 20, 50, 100, and 200 exponential moving averages, and buyers are still holding on to the $1,846-$1,860 support zone.
What is the RSI reading now?
The 50.09 RSI level indicates that momentum is neither clearly in buyers’ nor clearly in sellers’ favour, and is balancing.
Why is Ethereum’s bearish social sentiment important?
For the third straight month, social sentiment dipped into the negative, according to Santiment. Past occurrences have been met with short-term price rallies, but the firm pointed out that sentiment alone isn’t enough to ensure a pullback.