
- Bitcoin price prediction holds its ground amid weak momentum.
- Galaxy has just invested $5M in a quantum security project for Bitcoin.
- Derivatives had higher numbers of long positions but high open interest as well.
The price of Bitcoin is back in the limelight since the crypto asset has fallen into a consolidation pattern on the back of prices falling below $67,000.
As of press time, Bitcoin was trading at $65,900 in the most recent session, after failing to sustain the rally towards $66,900, with some technical factors pointing to crucial support and resistance areas for the next move.
Bitcoin Price Prediction Highlights Key Technical Levels
The BTC/USD pair was valued at around $65,959, showing an increase of 0.3%over the past 24 hours. During the period under review, the crypto asset gained ground and approached $66,700, but then reversed some of those gains and settled at present levels.
The market cap stood at $1.32 trillion, and the daily volume of trades amounted to $30.64 billion. Bitcoin’s circulating supply stood at 20.05 million BTC, with the protocol’s maximum supply remaining fixed at 21 million BTC.
| Bitcoin Market | Value |
| Current Price | $65,959 |
| 24-Hour Change | +0.3% |
| Market Capitalization | $1.32 Trillion |
| 24-Hour Volume | $30.64 Billion |
| Circulating Supply | 20.05 Million BTC |
| Maximum Supply | 21 Million BTC |
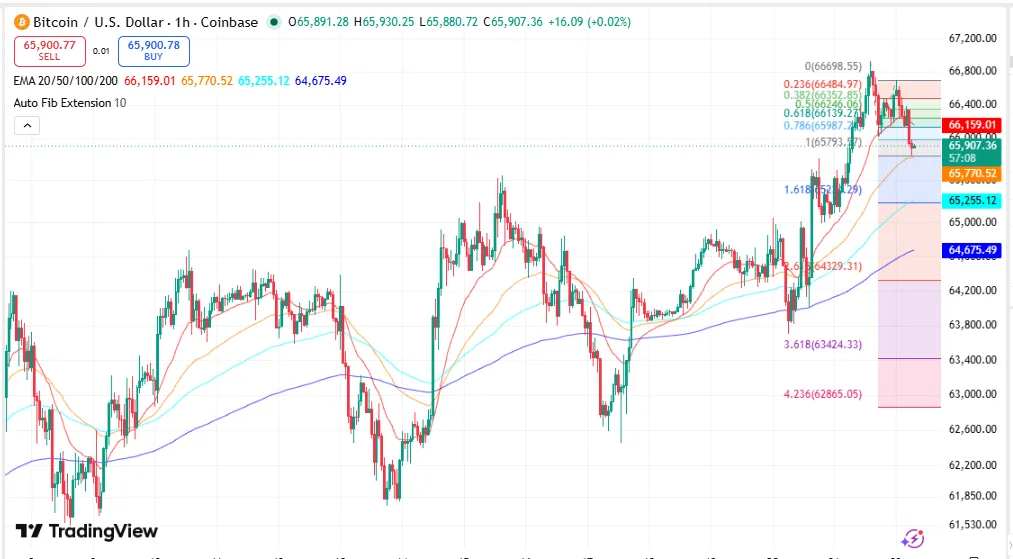
On the one-hour Coinbase chart, Bitcoin traded near $65,925 after slipping 0.02% during the session. It was above the 100-period moving average level at $65,242 and the 200-period moving average at $64,663, maintaining vital support levels.
Nevertheless, Bitcoin remained below the 20-period moving average at $66,188 despite its approaching the 50-period moving average at $65,766, indicating a loss of bullish momentum after having been rejected recently.
Technical Indicators Indicate Reduced Buying Pressure
A few technical indicators pointed to reduced short-term momentum owing to the discovery of nearby resistance and support levels.
The Relative Strength Index (RSI) was observed at 45.70 levels, falling below its signal line of 56.01, suggesting the decrease in buyers’ interest when compared to previous trading sessions.
Source: Trading View
In addition, the Stochastic RSI fell to 7.48 levels, putting the oscillator into oversold zone due to the pullback of Bitcoin below approximately $66,700.
According to the Fibonacci retracement tool, Bitcoin is heading towards the 0.786 retracement zone at $65,877, while being traded above the 1.618 extension zone at $65,214.
Technical Analysis Points to Note
- Bitcoin holds above both the 100 EMA and 200 EMA levels, sustaining its overall short-term technical formation.
- RSI below 50 and an oversold condition on the Stochastic RSI indicate weaker buying pressure following the previous price rally.
- Fibonacci analysis indicates that $65,214 is short-term support while resistance is above $66,000.
Support, Resistance and Bollinger Bands Determine the Price Range
Other chart tools provide additional indications about Bitcoin’s price range. The support and resistance analysis revealed broader support at $63,702 and immediate resistance at $66,924.
Bollinger Bands have also shown the current retreat. The price is close to the lower Bollinger Band, trading near $65,909, whereas the middle band was located at $66,372, and the upper one at $66,835.
Furthermore, retreating to the lower band happened due to the inability of Bitcoin to retain the price above the middle band in the last session.
Derivatives Data Reveals Continued Participation
The derivatives data indicated that market participants were continuing to have long exposure despite the latest price movements.
Binance had a long-to-short account ratio of 1.0454 for BTC/USDT and 1.1711 for the long-to-short account ratio of the top trader. The position of the top trader on Binance had a long-to-short ratio of 1.4353.
During the previous 24 hours, $69.96 million in positions were liquidated. The total included $57.38 million in short liquidations and $12.58 million in long liquidations, showing short sellers accounted for most forced position closures.
Source: Coinglass
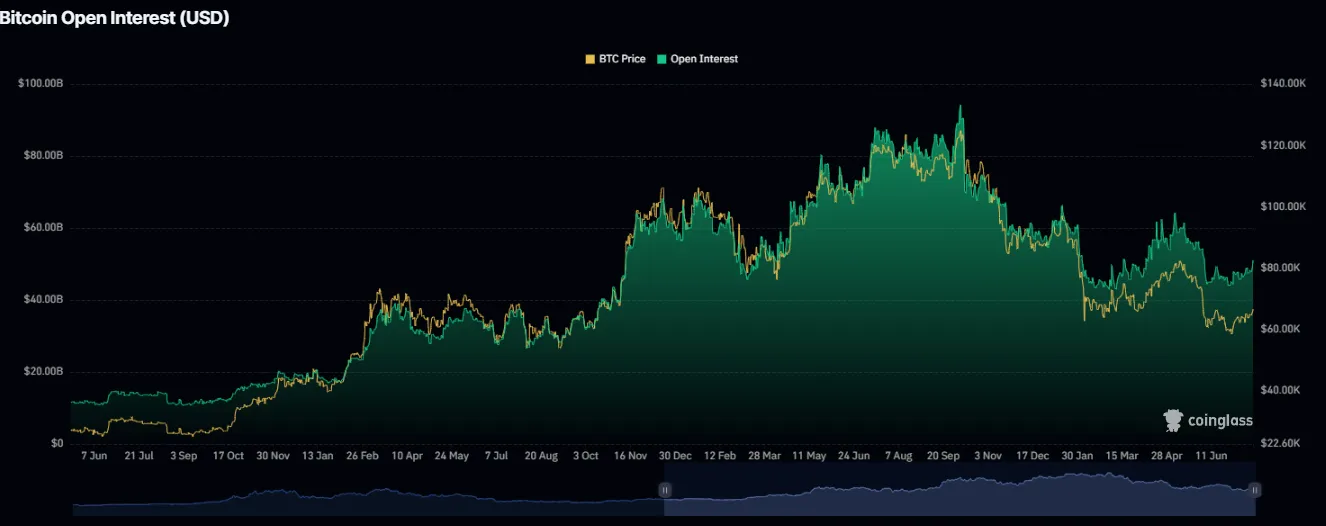
Open interest also remained elevated. Following its earlier peak above $80 billion, open interest followed the trend correction while stabilizing in the range of $45-$50 billion, thus reflecting ongoing leverage within the derivatives market.
Long-Term Quantum Security Initiative Launched
The Galaxy Digital company launched a $5 million long-term initiative aimed at ensuring the cryptographic security of Bitcoin over time. The funds are expected to be used on quantum-resistant signature schemes, wallet migration, and independent security audits.

Source: BSCN
According to the firm, the program is designed to allow the developers to get ready for quantum computing threats in the future. Scientists still claim that quantum computing poses no immediate danger to Bitcoin at the moment, although in case of the future change of cryptography, the process will need to be extensively tested.
Bitcoin Price Prediction Outlook
The recent Bitcoin price forecast continues to focus on several specific technical levels. Immediate support can be found in the range between $65,214 and $65,242, whereas more extended support is set at $63,702. Resistance is seen around $66,188, $66,835, and $66,924.
Bitcoin currently remains above longer-term moving averages, even as momentum readings on the shorter-term side have turned negative. Meanwhile, derivatives, open interest, and market structure are still sending out relevant signals for those looking to make the next trade.
FAQs
What is the nearest support level for Bitcoin?
Nearest technical support is at $65,214-$65,242, with wider support at around $63,702.
What is the nearest resistance for Bitcoin?
Important resistance levels include $66,188, $66,835, and $66,924, as determined from moving averages and Bollinger Bands.
Why did Galaxy Digital make a quantum security project?
The project aims to invest in quantum-resistant signatures, wallet migration technology and security audits.