Key insights:
- Bitcoin has a healthy history of higher lows since 2017 and is a contributor to the long-term structural power during corrections.
- The range of $56,500 to $78,519 is a compression phase that is also typical of the past high-volatility expansions during prior periods.
- Rebounds by this structure in history have seen capital inflows accelerating in the wake of consolidation at major support levels.
Bitcoin is on the verge of a critical period, as price is consolidating around a long-term rising support line. The weekly pattern indicates that price and this trendline interact repeatedly through several cycles. Each interaction coincides with the end of a corrective phase and the beginning of upward expansion.
Bitcoin bounced back sharply in 2017 after hitting this structural level, and registered a gain of about 968%. The market subsequently rectified the market and returned to the same support in the next cycle. That stage generated a 259% rise, which put in place a higher low, and the overall uptrend.
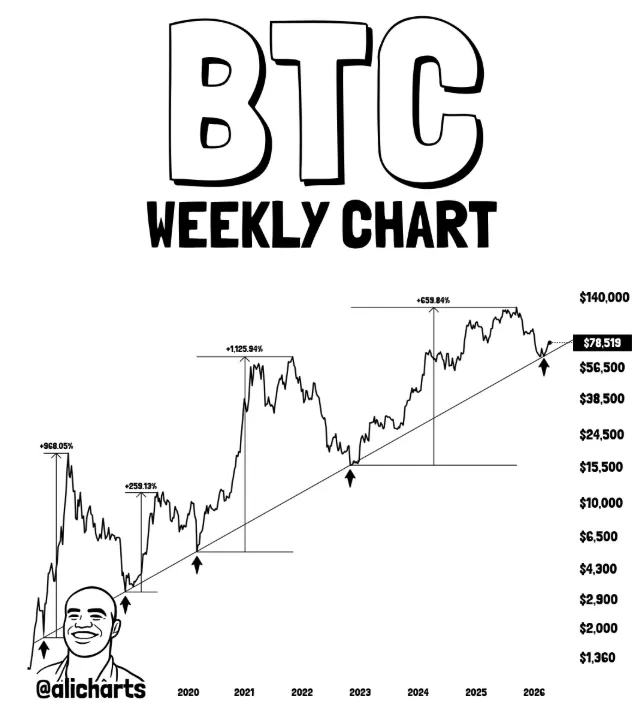
The 2020 cycle was marked by greater growth, with the asset rising about 1,126% following another encounter with the trendline. This action established a new macro high and supported the uniformity of the structure. Price subsequently fell, but continued to be in line with the same upward support.
In the 2022 cycle, It once again responded at this stage and surged higher by an estimated 660%. Every cycle created a higher bottom and retained the upward momentum. The series of corrections and expansions represents a cyclic organizational pattern in the history of the market.
Present value movement and framework.
Bitcoin is currently trading at around $65,000 but still above the rising support level. This position is in line with the lows of the past cycles where the price leveled off and then began to rise. The market will stay in its form as long as the price remains above this trendline.
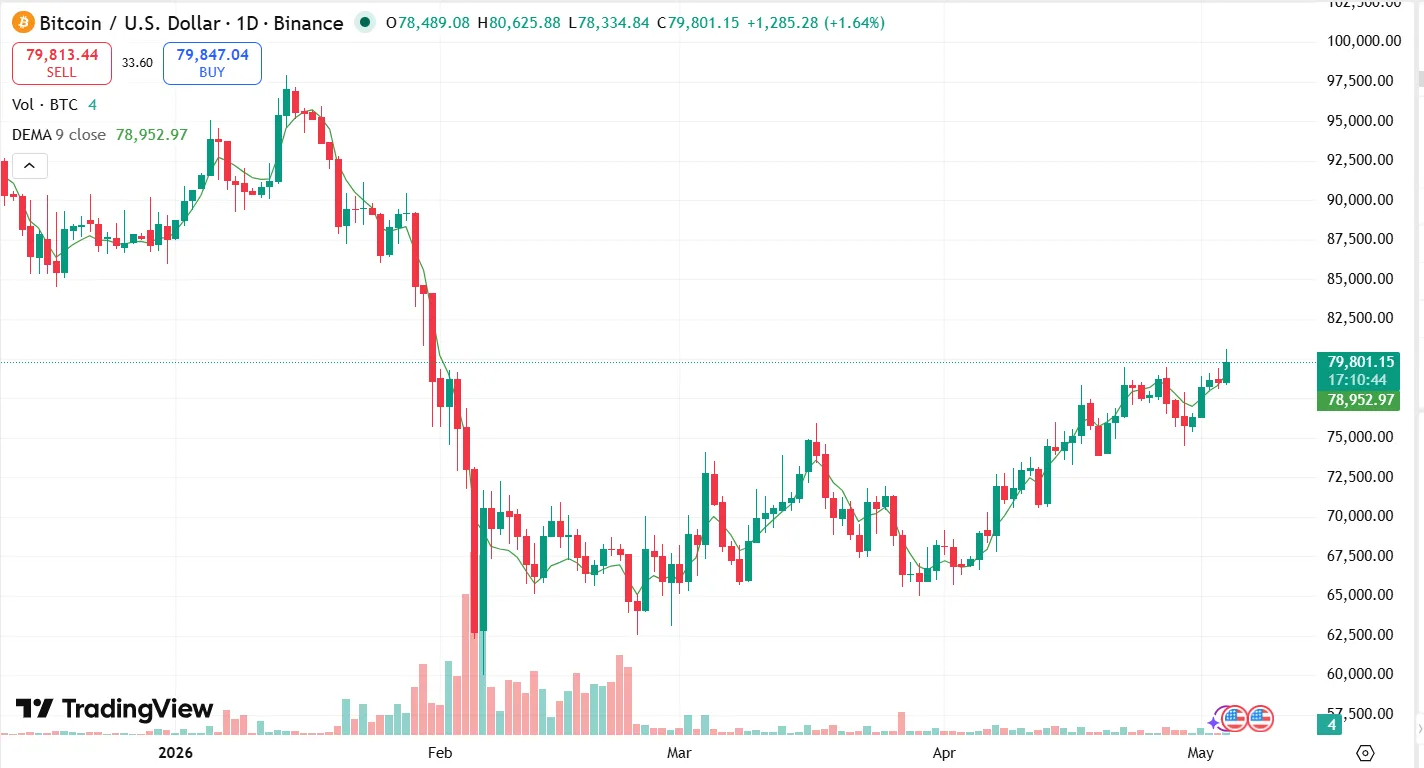
The existing trading range is characterized by the levels of approximately $56,500 and $78,519. These levels serve as short term support and resistance levels in the overall trend. Price is still oscillating within this band without tampering with the structure.
More optimistic long term forecasts are in the areas of the $140,000 mark, which is indicative of the magnitude of the earlier phases of expansion. The historical movements exhibit a steady percentage growth after each time they interacted with the trendline. These expansions occur after some consolidation around important support.
Bitcoin has a series of higher lows on all major corrections since 2017. The structure has not broken down confirmed below the rising trendline. Present price action indicates a second stabilization period around this long term support level.
Bitcoin holds $65K support as historic trendline signals potential cycle turning point
Bitcoin is trading at a price of approximately above $65,000 and is currently in a higher position than a long-term ascending support level that has been tracked through several cycles.
This construction has established key market turning points since 2017 and has been used to direct price behavior.All past experiences with this level were associated with the termination of corrective phases and the onset of expansions. Bitcoin recovered in 2017 out of this structure and experienced a 968% increase in the next expansion phase.
The market subsequently made a correction and returned to the same level, achieving a gain of 259% in the following cycle. In 2020, Bitcoin had made an improvement of about 1,126% when it again interacted with this support.This not only resulted in establishing a new macro high but also in the consistency of the long-term structure.
Bitcoin replied at the same level and increased by an average of 660% in 2022. All the cycles were marked by less highs and the general tendency was to rise.There is a trend of correction followed by the growth over a matter of years which is a common trend.
Impact on the market
The current range of trade is between $56,500 and $78,519 which clearly shows that there is a clear range within which Bitcoin can trade in the short-term. Price is above the lower limit, structurally consistent with past cycles. This positioning is an ongoing support at the long-term trendline with no confirmed break.
This level is tracked by market participants because it has again and again played the role of marking cycles lows. Maintaining a position of above $65,000 maintains the greater framework and retains higher low formation.
History demonstrates that such circumstances have been followed by the significant positive shifts in the past cycles. The projected levels are stretched to reach up to $140,000, indicating the extent to which expansions have been in the past.These estimates are in line with historical percentage increases after each trendline interaction.
The market structure has been enjoying a stable distance between correction and expansion stages. Bitcoin has a consistent series of higher lows since 2017 that have not failed structurally. This trend is an indication of long-term accumulation trends during corrective periods.In the vicinity of major support levels, price stability is frequently associated with less downside price volatility.
Conclusion
Bitcoin is still above a very important ascending support line of about $65, 000.This building still echoes the past trends of corrections and subsequent expansion stages.The current trading range is determined by key levels of $56,500 and $78,519.
The projections are long term targeting to a level of $140,000 owing to the past cycle trends.Higher lows in the market in all major corrections that have taken place since 2017.
FAQs
1. Has Bitcoin bottomed at $65,000?
Bitcoin has a long-term support at approximately over 65,000, which aligns with the bottom of the previous cycles.
2. What is the significance of the trendline that is rising?
This trendline has indicated large bottoms of the cycle and has been followed by large percentage gains since 2017.
3. What is the critical support and resistance levels?
The support is close to $56,500 and the resistance is near to 78,519.
4. What had been gains in the past after such arrangements?
Bitcoin recorded gains of 968%, 259%, 1,126%, and 660% after past interactions.
5. What is the second large price forecast?
The historical growth trends go up to the point of $140,000.