Key Insights:
- Ethereum is also in a range between $1.8K and $2.4K, an indicator of market equilibrium where traders are waiting to get a clear direction on market breakout.
- The increasing wedge arrangement in the lower periods indicates the deterioration in the bullish momentum, making it more likely to have a fall.
- The liquidity concentrated under the level of $1.8K might become of interest to the price movement, which may increase volatility faster should the bearish pressure accumulate.
Ethereum still represents a form of balanced market structure balancing between buyers and sellers that are still in the stalemate stage.After the previous remedial action, Ethereum has now moved to the consolidation stage, with the volatility narrowing as the participants prepare to make the next action.
The price action indicates a steady response between the support zone of $1.8K and the resistance zone of $2.4K affirming the two zones as the supreme limits.
This action draws emphasis to a market not in a trending or a collapsing mode, but rather, in a rotating nature within a controlled framework with supply and demand as the key influencing factors.
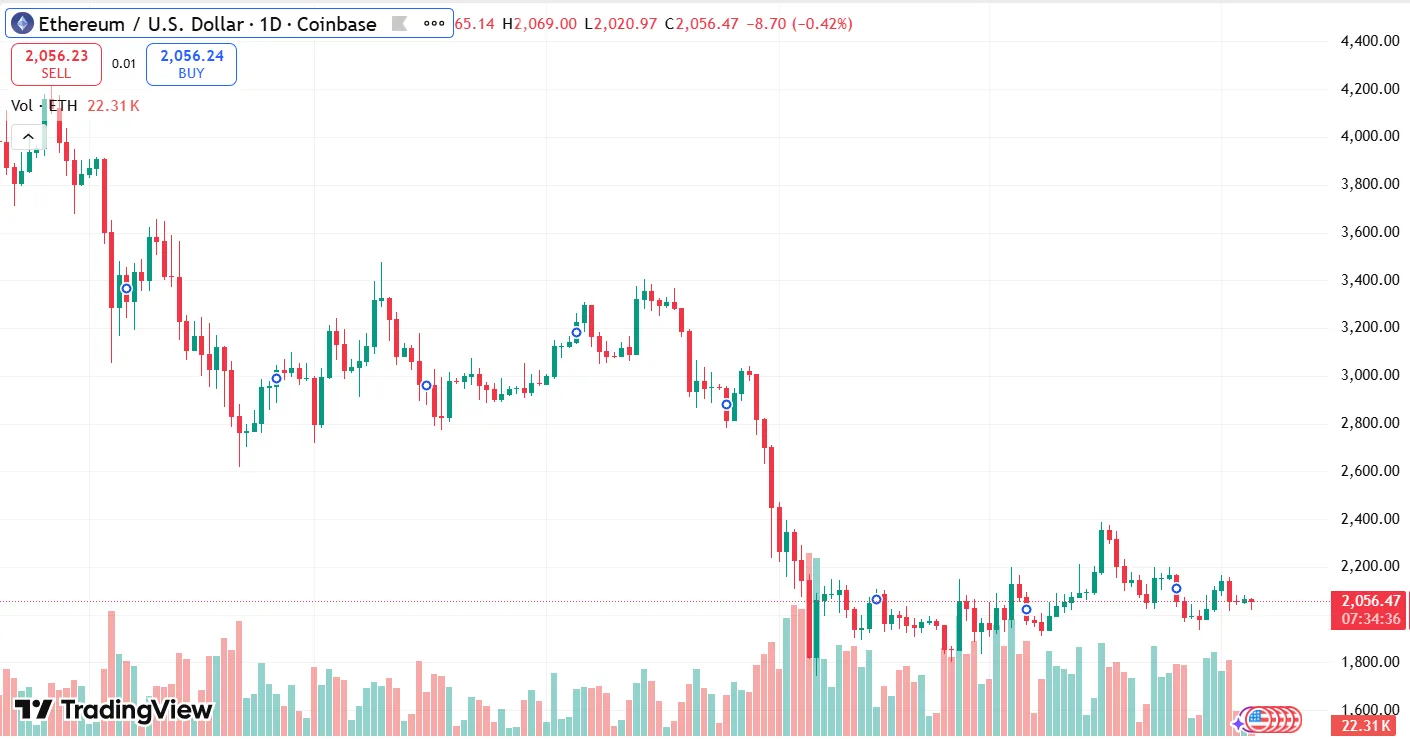
Strong resistance and support are ascertained through daily chart.
Regarding the daily chart, Ethereum is strongly held in a horizontal trend, with frequent attempts of the two limits confirming their technical significance.
The fact that Ethereum has not been able to maintain a move above or below either level is indicative of indecision as traders may be waiting to be convinced in order to set up directional exposure.
Provided that this range is not violated, Ethereum is likely to continue its neutral bias, with short-term trades prevailing in the entire market activity.Such a breakout above the $2.4K mark might change the mood to a bullish continuation and a breakdown of below $1.8K might result in days of downward pressure.
Ethereum ascending wedge ailing positive momentum.
Ethereum on the lower time frame is shaping a rising wedge pattern, which is normally a sign that the bullish momentum is slowly wearing out.Even though the asset still records increased highs and increased lows, the contracting structure is an indication of reduced buying power.
This arrangement indicates that new upward trends in Ethereum are corrective but not impulsive and agree with the larger consolidation on the daily chart.The higher the pattern is matured, the higher the probability of breakout, and downside risk seems to be higher in the short run.
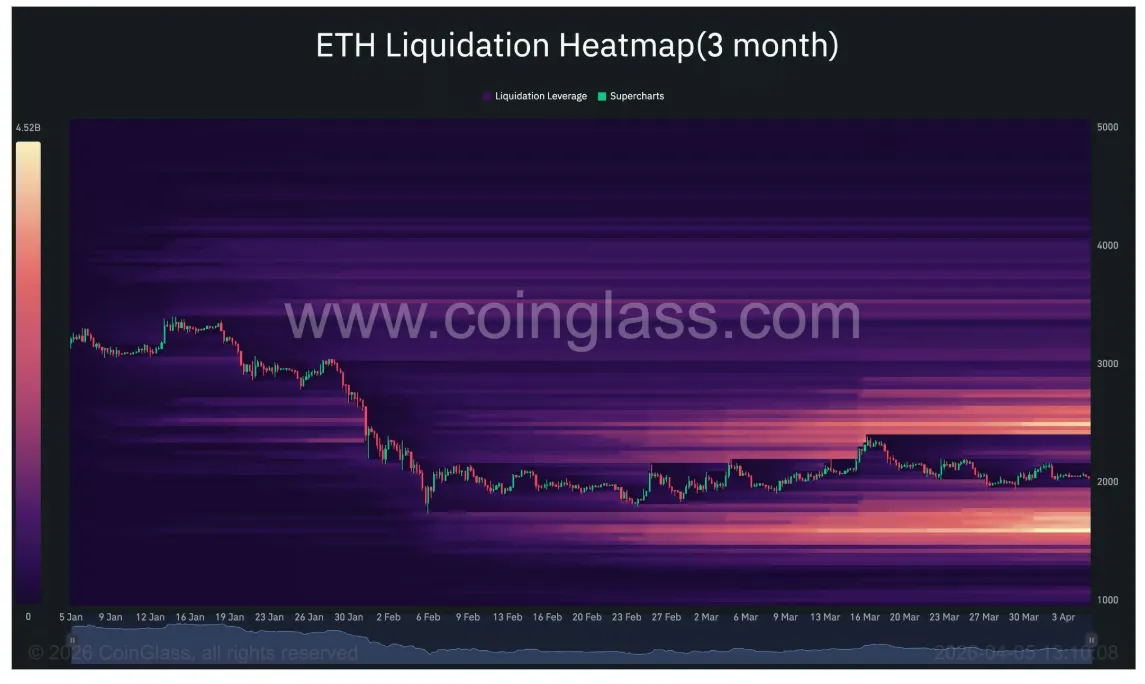
The market is attracted to liquidity cluster around $1.8K.
In terms of liquidity, Ethereum demonstrates that the liquidation levels are concentrated in the area of and below the support zone of $1.8K.These liquidity pools tend to be price magnets, and the movement in the market will be attracted by them as traders aim to set off a stop order and unlock volatility.
In case bearish momentum starts gathering, Ethereum might be attracted to this zone, and a series of liquidations might speed up the price changes.This causes the $1.8K level to not only be a technical support level but also a level of liquidity crisis in the existing structure.
The breakout potential increases with the approach to apex price.
The likelihood of a decisive move in Ethereum is still growing as the price conditions narrow around the peak of the ascending wedge.Compression periods tend to be followed by volatility expansion implying that the present tranquil period might be replaced at any moment.
A failure of the wedge would affirm bearish continuation, taking Ethereum down to lower levels and challenging crucial liquidity areas below support.On the other hand, breaking out of the resistance would nullify the trend, which would allow the market to resume its upside movement and trend generation.