

Bitcoin has flashed a technical signal that previously appeared near major market bottoms, drawing attention from analysts monitoring the latest recovery.
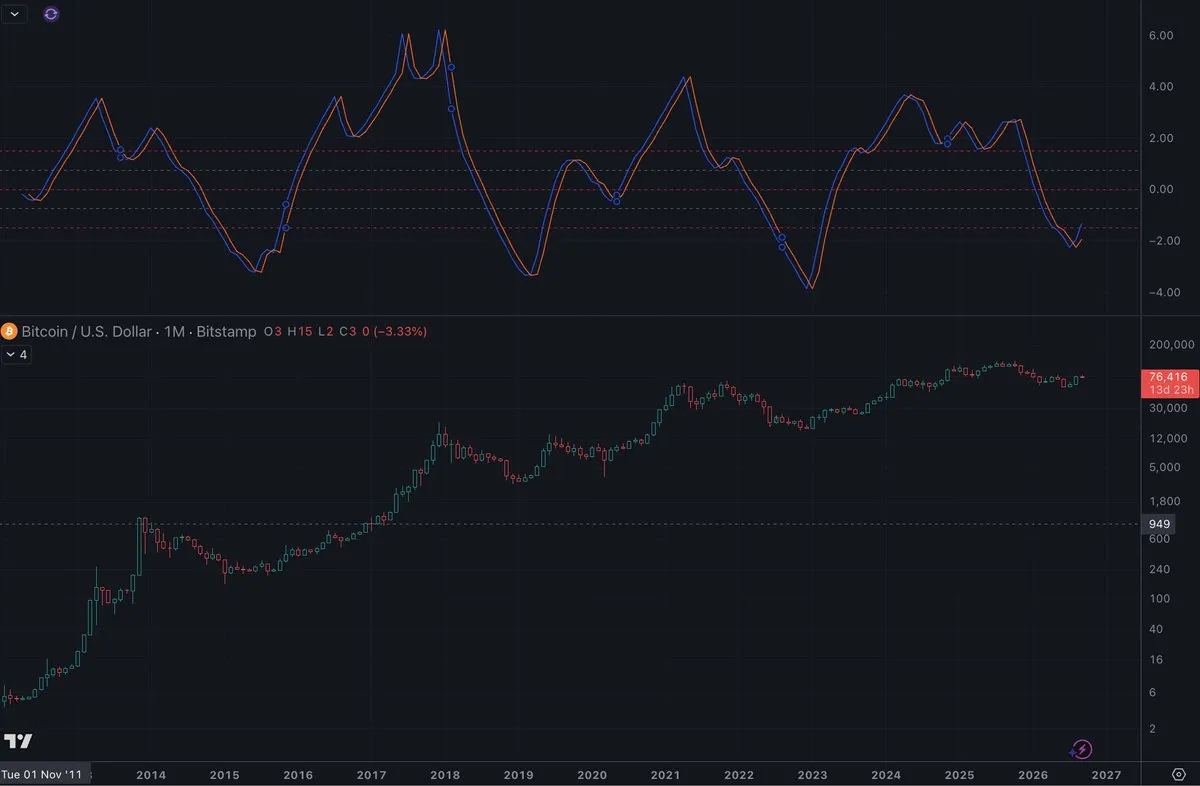
Analyst Willy Woo said the latest Fisher Transform crossover appeared in July at -2.26. He noted that three earlier crossovers on monthly charts coincided with Bitcoin bear-market bottoms. However, the indicator does not guarantee that prices will immediately turn higher.
“BTC bottoms: 3 for 3 without fake out. Latest cross is the 4th on record,” Woo said in a post on X Friday.
Source: X
Woo cautioned that Bitcoin could still spend more time consolidating before making another sustained move higher. That leaves the latest crossover as a technical signal to monitor rather than confirmation of a new market trend.
Fisher Transform Signals Another Potential Bottom
The Fisher Transform is a technical indicator that tracks changes in price momentum through two lines: the Fisher line and a trigger line. Traders watch their crossovers for potential changes in market direction.
Woo’s chart shows the latest bullish crossover forming after Bitcoin’s prolonged decline. Similar monthly crossovers appeared around major market bottoms in his analysis.
The indicator can also produce temporary signals during bull markets. Woo noted that the Fisher Transform has at times turned bearish before crossing back into bullish territory, reflecting sharper price swings during periods of elevated speculative activity.
Woo said market bottoms can be easier to identify because buying tends to return when investors see value, while speculative activity may be weaker.
“When price falls to a point where investors find value, buy-pressure fires back up but we are devoid of speculators,” he said, adding that this can lead to cleaner reversals and fewer short-term swings.
Altcoin Market Breaks a Long Downtrend
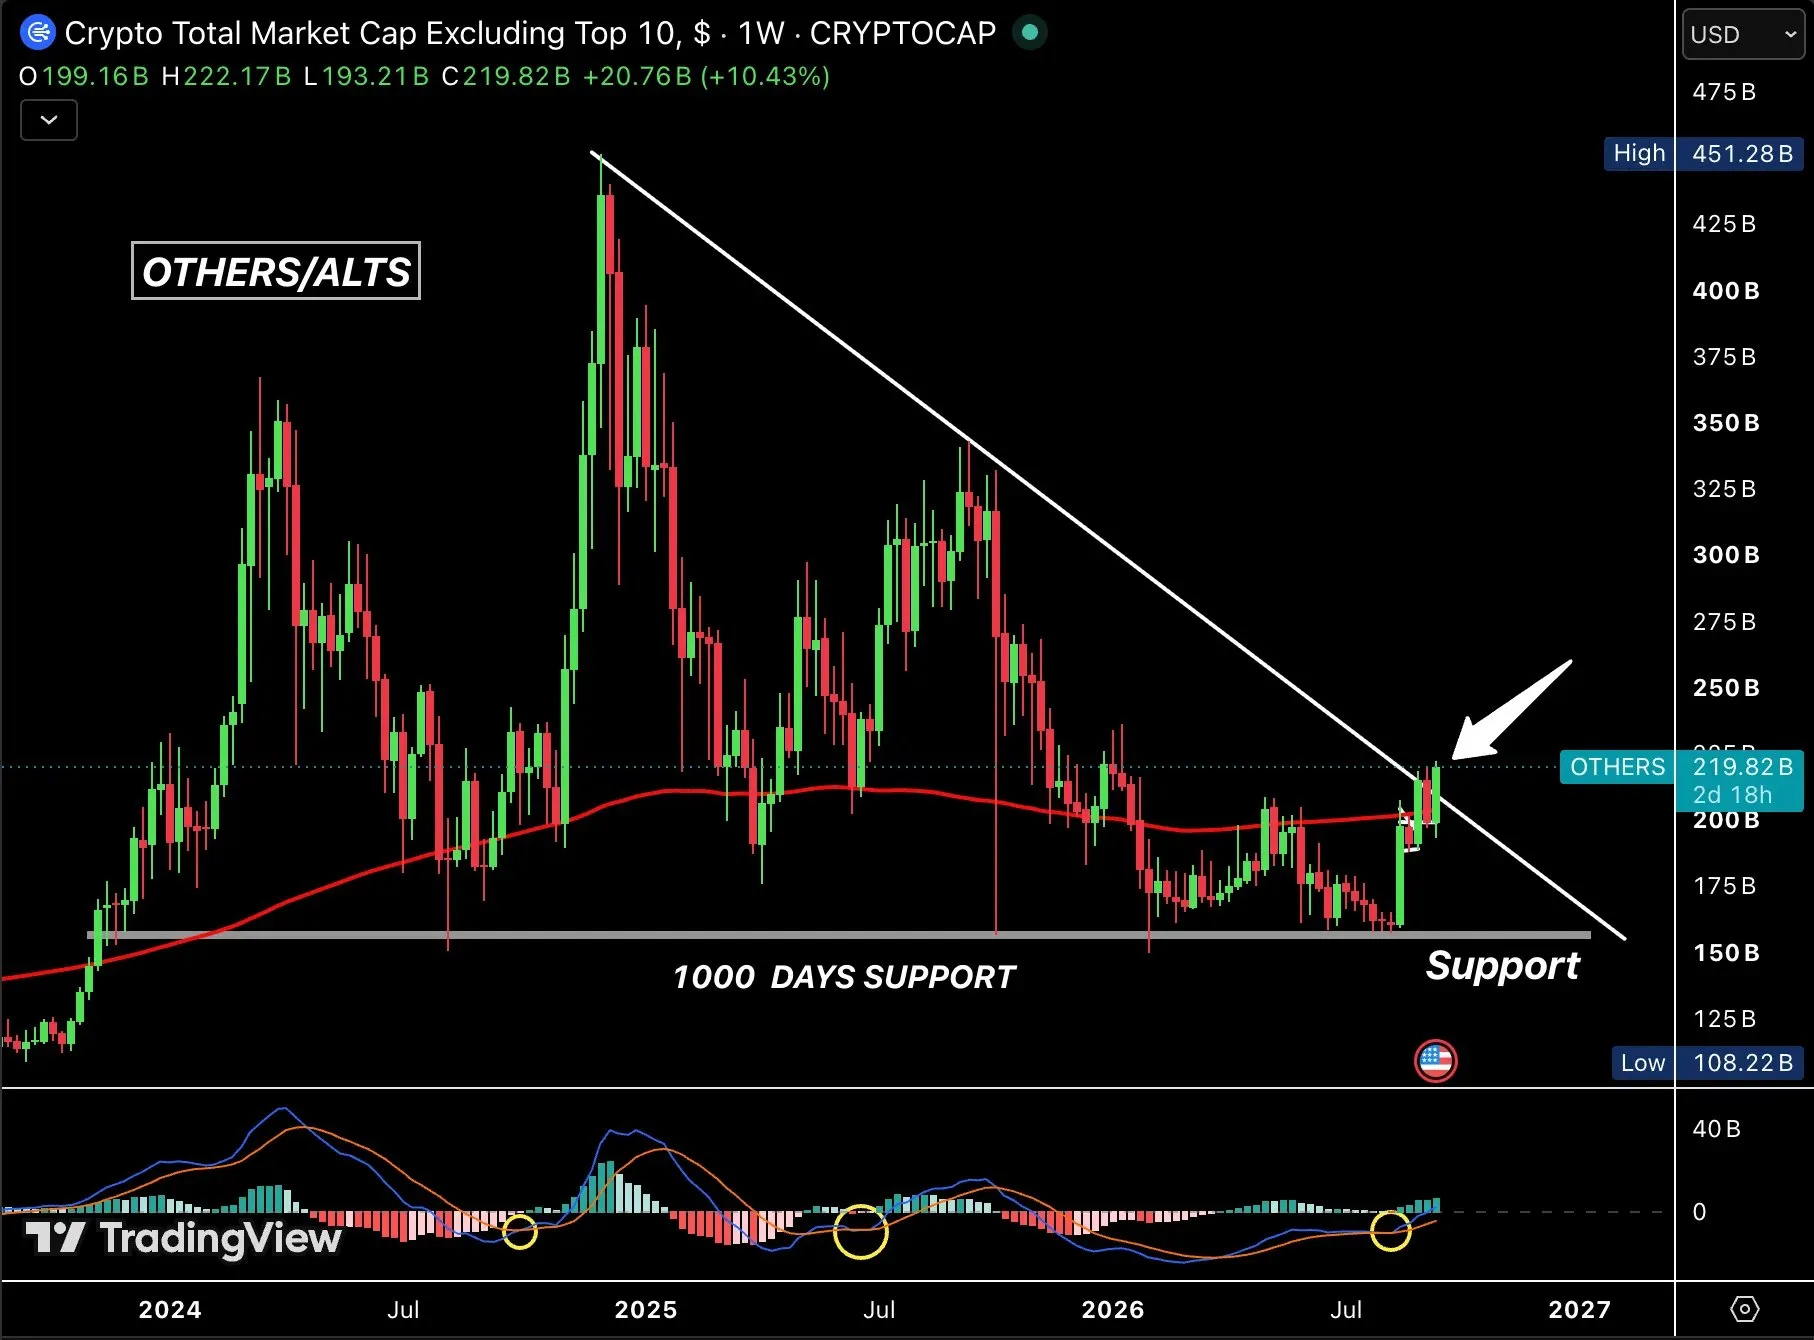
The broader altcoin market has also broken above a descending trendline. Its total market capitalization stood at about $219.82 billion after rising 10.43% over the latest weekly period, according to a chart shared by Ash Crypto.
The move pushed the market above resistance linked to its late-2024 peak. The breakout followed a prolonged decline marked by several lower highs.
 Source: X
The altcoin market had previously climbed to about $451 billion before entering the decline. The subsequent lower highs kept the market below a descending trendline that became a reference point for the broader downtrend.
The latest breakout has yet to be confirmed. Ash Crypto said the market needs a weekly close above the trendline for the move to maintain momentum. If that fails, his chart points to the $160 billion to $190 billion area as a potential support zone.
The market is therefore testing whether the latest move above the trendline can hold through the weekly close.
Long-Term Support Remains in Focus
The altcoin market is also trading above a historical support level near $155 billion, which the chart labels as “1000 DAYS SUPPORT.”
The market tested that level several times in 2026, with each pullback followed by a rebound. The latest advance toward $220 billion therefore comes after repeated buying around the same area.
Momentum has also moved higher. The indicator below the chart has turned upward from negative territory, while its histogram has entered positive territory.
The $155 billion level remains a reference point if the market reverses from current levels. Meanwhile, the recent move above the descending trendline leaves the weekly close as the next test for the breakout.
Bitcoin Tests Its 50-Week EMA
Bitcoin has climbed back above its 50-week exponential moving average as the cryptocurrency recovers from its 2026 lows.
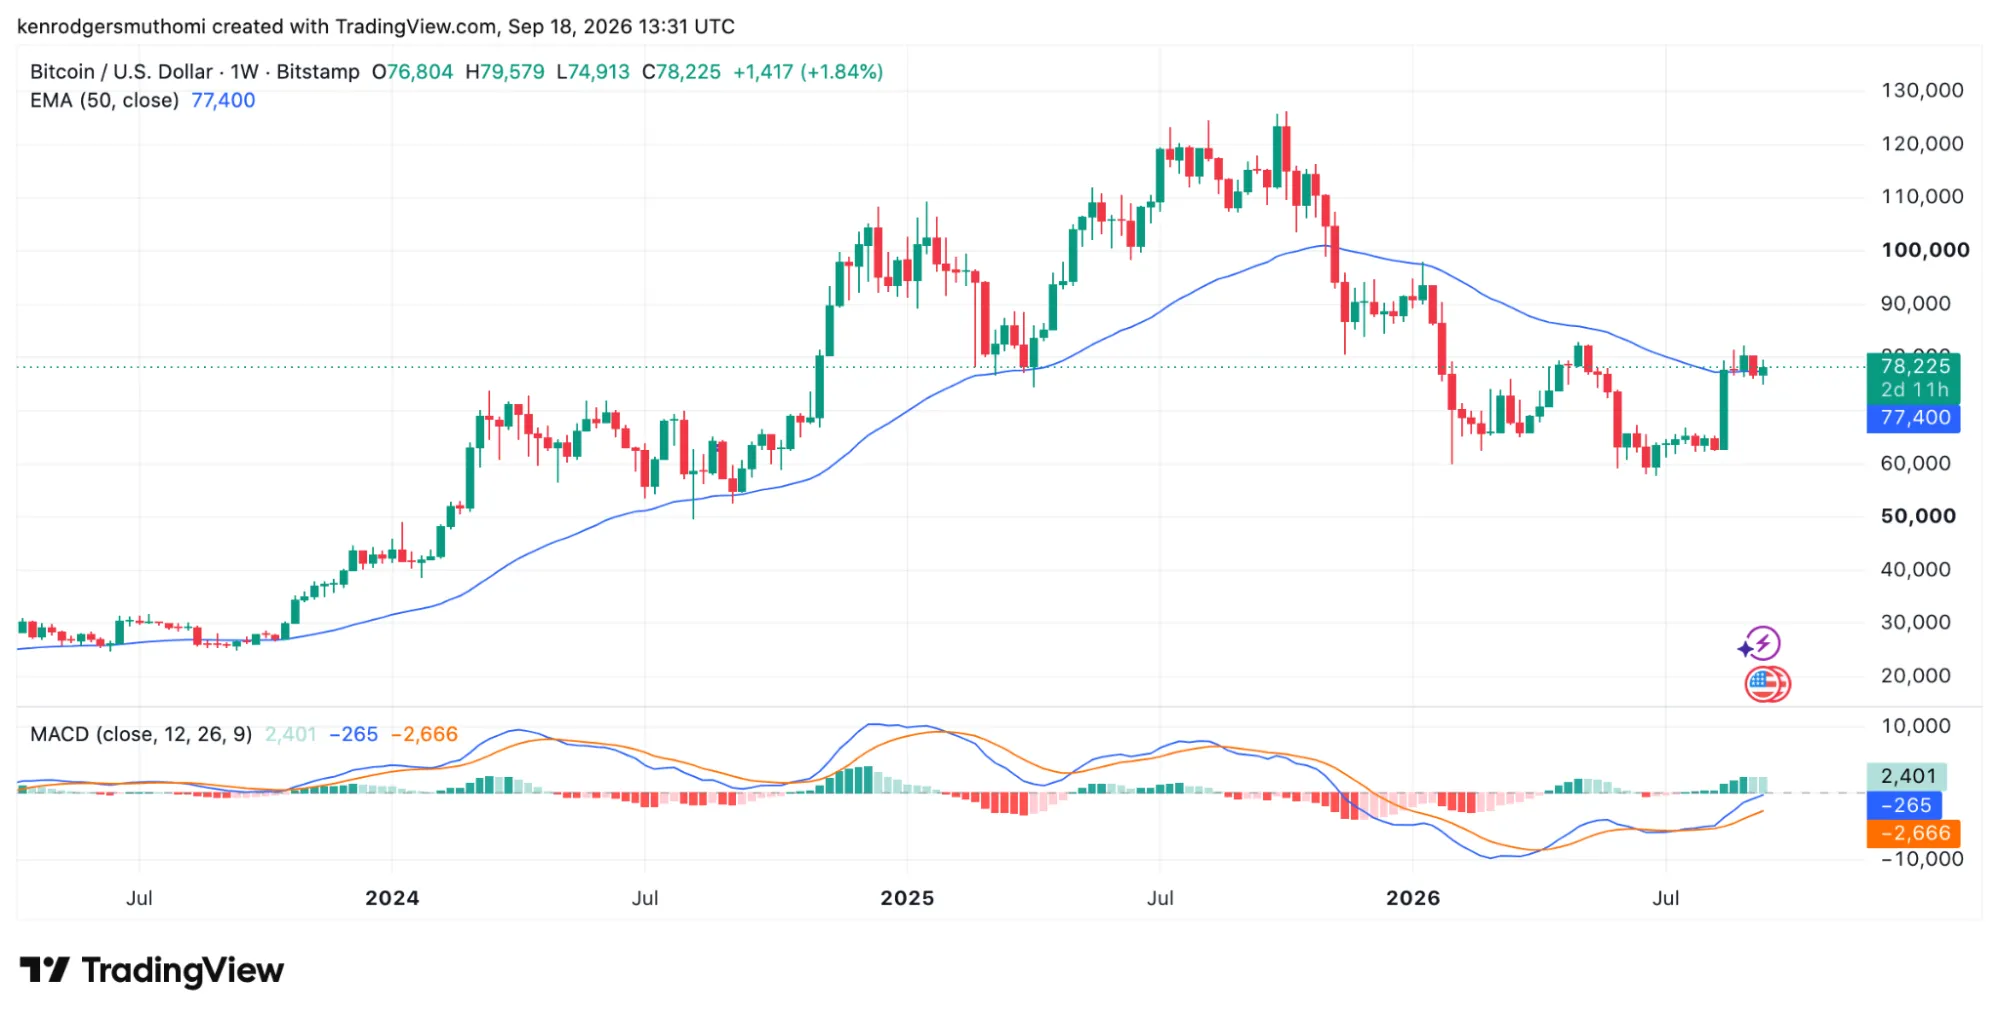
BTC was trading near $78,225 on Sept. 18, compared with about $77,400 for the 50-week EMA. The price was therefore roughly 1.1% above the moving average.
The latest weekly candle opened at $76,804 and rose as high as $79,579 before falling to $74,913.
 Source: TradingView
Bitcoin had climbed above $120,000 in the second half of 2025 before retreating toward $60,000 during 2026. The market later found support around that level and recovered toward $80,000.
The 50-week EMA now sits just below the current price, making it a nearby technical reference. The relationship between BTC and the moving average will provide another measure of whether the recent recovery continues.
MACD Shows Momentum Improving
Bitcoin’s momentum indicators have also improved, although the MACD remains below zero. The MACD line has moved above its signal line, while the histogram has turned positive.
The MACD line stood near -265, compared with about -2,666 for the signal line. The histogram was around 2,401.
The crossover indicates a shift in momentum, but the negative MACD reading shows that the indicator has not yet moved into positive territory.
Bitcoin is approaching $80,000, while the 50-week EMA near $77,400 provides a nearby technical level. The Sept. 18 weekly candle had not closed when the chart was recorded, so the readings could still change before the week ends.
Woo has also pointed to relatively limited buying around Bitcoin’s recent lows. His analysis indicated that only a small group of larger investors accumulated during the decline.
https://x.com/willywoo/status/2098210518649737295?s=20
The Fisher Transform crossover, altcoin breakout, moving-average recovery and MACD shift provide several technical developments to monitor. However, the signals remain subject to confirmation through subsequent price action and weekly closes.