

- Bitcoin increased by 10.06% over a period of seven days to trade at around $80,000 during the period.
- Bitcoin ETFs saw an inflow of $232.1 million and maintained their streak of eight consecutive sessions.
- Bitcoin RSI rose to 81.11 levels while other ETFs including Ethereum and XRP saw positive inflows as well.
Bitcoin is currently trading at $79,416 as its price rose by 10.06% in the last week, while its market capitalization was $1.59 trillion, and the 24-hour trading volume was $31 billion.
The move followed a recovery from lows near $57,600 and a breakout above key technical levels. Spot Bitcoin exchange-traded funds (ETFs) in the United States also recorded a combined $232.1 million in net inflows on Wednesday, extending their inflow streak to eight trading sessions.
Bitcoin Breaks Above Key Daily Moving Averages
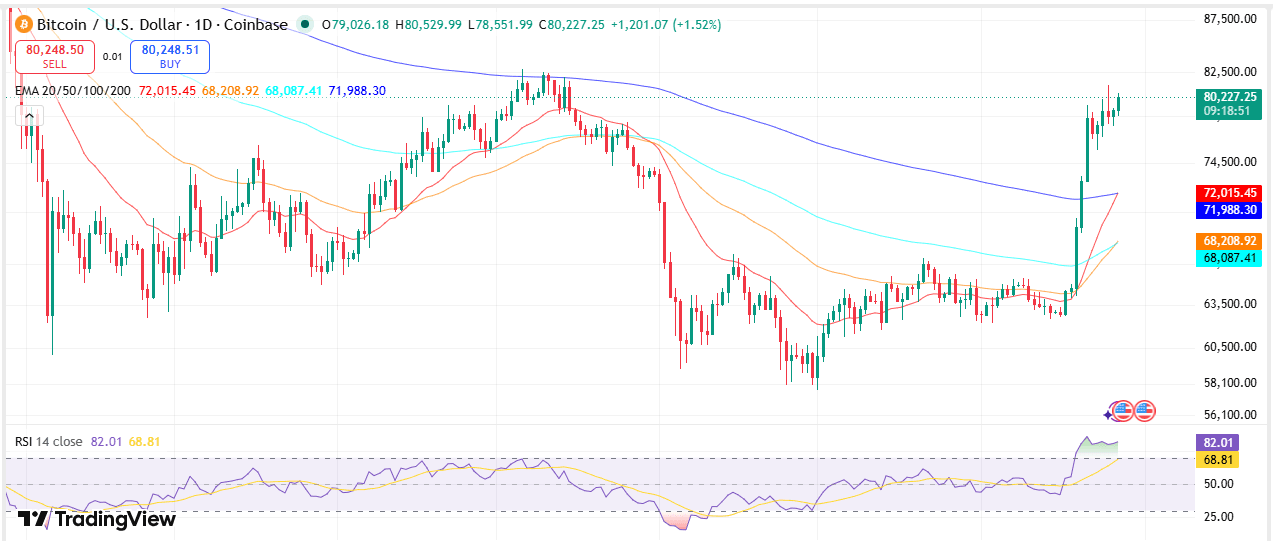
Bitcoin’s daily chart showed price trading around $79,427, up 0.51% on the session, after reaching an intraday high of $80,511. The recovery from the $57,600 area marked a sustained rise through several daily exponential moving averages (EMAs).
The 20-day EMA stood at $71,939, while the 50-day EMA was at $68,178. The 100-day EMA was positioned at $68,072, and the 200-day EMA stood at $71,981. Bitcoin moved above all four levels during the advance.
The 50-day and 100-day EMAs were clustered around $68,000. The price subsequently moved through the 200-day EMA and continued toward the $80,000 level.
Bitcoin also cleared resistance around $66,921. A support level identified on the chart stood at $62,470.
Bitcoin RSI Enters Overbought Territory
Momentum indicators showed elevated buying activity during the latest advance. The 14-day Relative Strength Index (RSI) was recorded at 81.11, above the standard 70 threshold used to identify overbought conditions.
Source: Trading View
The reading accompanied Bitcoin’s move from the $57,600 region toward $80,000. The RSI level indicates that price had moved into deeply overbought territory at the time of the data.
The Bollinger Bands also reflected the strength of the move. Bitcoin was trading near the upper band at $83,348, while the 20-period simple moving average stood at $69,670.
Fibonacci Levels Cleared During the Rally
The chart showed Bitcoin moving above several Fibonacci extension levels during the recovery. The 1.618 extension was marked at $67,647, followed by the 2.618 level at $70,847 and the 3.618 level at $74,046.
The price also moved above the 4.236 extension at $76,024 before approaching $80,000. Bitcoin was subsequently reported around $79,474, with the earlier resistance level of $66,921 below the current price.
Spot Bitcoin ETFs Record Eight-Day Inflow Streak
U.S.-listed spot Bitcoin ETFs received $232.1 million in net inflows on Wednesday, according to the SoSoValue data cited in the provided information. The amount was approximately 26% lower than Tuesday’s $314.4 million inflow.
Wednesday’s figure was the smallest daily inflow since August 18. Despite the reduction, the funds extended their positive flow streak to eight consecutive trading sessions.
The eight-session period attracted approximately $2.8 billion in net inflows. Year-to-date net outflows declined to about $2.03 billion, while cumulative net inflows increased to $54.6 billion. Total net assets reached $98.6 billion.
The ETF inflows occurred after Bitcoin briefly moved above $80,000 on Tuesday. Bitcoin was later reported trading near $78,759, down 0.3% over 24 hours.
Ether and XRP ETFs Also Record Inflows
U.S. spot Ether ETFs recorded an eighth consecutive session of net inflows on Wednesday, attracting $192.4 million.
Spot XRP ETFs also registered net inflows. The funds attracted $28.1 million on Wednesday, their largest single-day inflow since January 5. Cumulative net inflows for the XRP ETFs reached $1.62 billion.
The Crypto Fear & Greed Index rose to 71 from 65 the previous day, remaining in the “Greed” category.
FAQs
What is Bitcoin trading at?
Bitcoin was reported trading around $79,416, with separate chart readings placing it between $79,398 and $79,474.
How much has Bitcoin gained in seven days?
Bitcoin gained 10.06% over the seven-day period covered by the provided data.
What was Bitcoin’s RSI?
The 14-day RSI stood at 81.11, placing the indicator above the standard 70 overbought threshold.
How much did spot Bitcoin ETFs receive?
U.S.-listed spot Bitcoin ETFs recorded $232.1 million in net inflows on Wednesday, extending their streak to eight sessions.
What happened to Ether and XRP ETFs?
Spot Ether ETFs recorded $192.4 million in net inflows, while spot XRP ETFs attracted $28.1 million on Wednesday.