- Solana processed 1.01 billion weekly transactions; yet, the asset continued to be sold off.
- SOL traded below important moving averages and showed poor momentum.
- Long liquidations took place as open interest did not reach the previous level.
The price forecast for Solana continues to be relevant due to record weekly transaction volume. Solana network recorded the biggest number of weekly transactions ever on the blockchain, although the token itself continued to trade below the important technical levels. Solana recorded more than 1.01 billion non-vote transactions weekly up until August 2.
Solana Price Prediction Faces Technical Resistance
Solana was trading at $72.66, showing a fall of 1.79% compared to the past 24 hours. The market capitalization was $42.25 billion, and the daily trading volume was down by 16.5% at $1.46 billion.
On the 24-hour price chart, selling pressure prevailed as lower highs and lower lows were formed during the day. On the four-hour timeframe, Solana traded below the 20-period Bollinger Band middle line at $73.66 and slipped beneath the 0.382 Fibonacci retracement level at $73.31.
The token also moved below the 0.236 Fibonacci level near $72.84, while the lower Bollinger Band around the same level was breached. The movement reflected increasing volatility as price weakened further during the session.
Technical analysis pinpointed $71.88 as the closest level of support. Resistance was found at $73.31, $73.75, and $74.19, and any rebound would need the asset to breach these levels.
Some other trend indicators also pointed toward continued downward pressure. The cryptocurrency was trading below all key EMAs such as the 20 EMA of $73.44, the 50 EMA of $73.64, the 100 EMA of $74.24, and the 200 EMA of $74.88. As a result, all major EMAs were above the present price level, creating resistance levels.
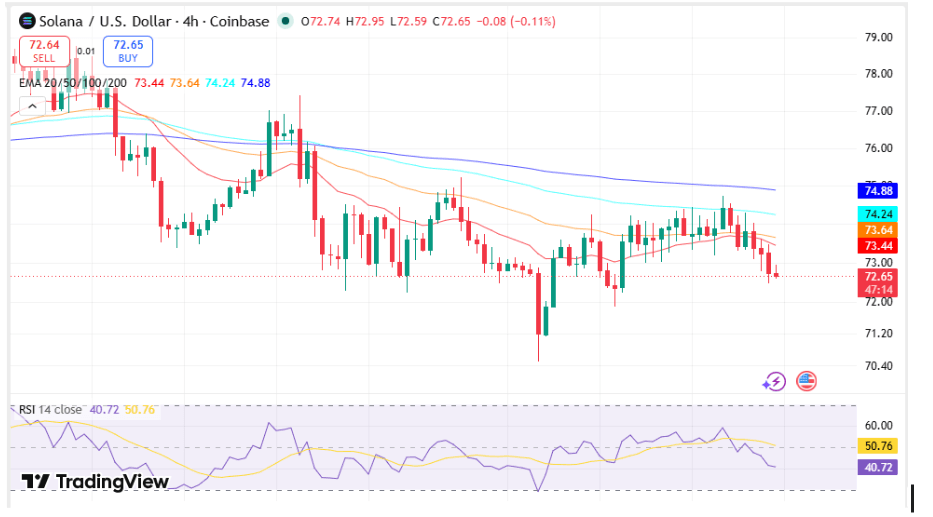
Source: Trading view
On the other hand, the value of RSI was 40.80, which was below its signal level at 50.77. While RSI did not fall into the oversold range, it indicated that there was weak buying pressure.
Solana Records Highest Weekly Transaction Count
Although the price was still struggling, there was some progress being made on the blockchain.
Solana network saw over 1.01 billion non-voting transactions in the week ending August 2, setting another record for the highest weekly transaction number seen on the blockchain.
The transaction numbers had been rising all year long to end up above 800 million each week before hitting the one-billion number.
The recent growth resulted from transactions that took place on different segments of the network. According to the data from TradingView, decentralized finance applications, stablecoin transactions, token launches, and consumer blockchain applications led to the growth of the transaction volume.
The milestone also showed the performance capabilities of the network based on its high throughput, low transaction costs, and quick finalization of transactions. Weekly transaction demand was still quite high due to other decentralized applications running on the blockchain.
Key On-Chain Highlights
- Weekly non-vote transactions reached above 1.01 billion, marking a new network record.
- The transaction activity has been exceeding 800 million for several weeks prior to the recent milestone achievement.
- Growth was caused by decentralized finance, stablecoin, token launches, and consumer applications.
Derivatives Data Shows Lower Speculative Activity
Derivatives metrics painted a contrasting image to the on-chain activity.
Open interest had once soared past $16 billion during price spikes and subsequently fell steeply as the token’s price fell. Open interest at present levels still remained significantly lower than those levels of earlier periods, suggesting that speculative participation was lower than in past cycles.
The positioning metric pointed to an increased preference for long positions even after the recent price dip.
The long-to-short ratio had been greater than 2.6 across exchanges, suggesting a bullish sentiment prevailed among participating traders. But liquidations showed that the long position had taken the hit.
During the past 24 hours, long liquidations totaled $2.92 million, while short liquidations reached $295,100. Over the previous 12 hours, long liquidations measured $1.63 million, compared with $133,450 for short positions.
Derivatives Snapshot
- Long-to-short account ratios remained above 2.6 across major exchanges.
- Twenty-four-hour long liquidations totaled $2.92 million, exceeding $295,100 in short liquidations.
- Open interest stayed below previous highs after earlier peaking above $16 billion.
FAQs
What milestone did the Solana network reach?
The network facilitated over 1.01 billion non-voting transactions in the week that ended Aug. 2, registering the highest transaction count in its history.
What are the technical metrics for Solana?
SOL was trading under all major exponential moving averages, important Fibonacci levels, and the middle line of the Bollinger Band. The RSI metric was at 40.80.
Solana Price Prediction What does the derivatives data suggest?
The majority were long positions with a long/short ratio above 2.6, but the liquidations of longs surpassed the liquidations of shorts within the last 24 hours.