

- Ethereum trades above important moving averages as the $1,870-$1,900 support zone becomes the focal point of the market.
- Inflows of Spot Ethereum ETF have become positive once again as OI recovery hints at derivatives action.
- Longs still outperform shorts amid resistance at $1,900-$1,956.
Ethereum is now embarking on yet another key period of trading after pulling back from its previous highs, with traders watching out for how long the current levels of support can hold up to the selling pressures that will be mounting soon.
Ethereum was trading at around $1,884.75, declining by 2.27% within the past 24 hours due to the inability to sustain any moves beyond $1,900. In such an environment, the current Ethereum price prediction revolves around how Ethereum can sustain support near $1,880 amid mixed technical readings.
Ethereum Price Prediction Highlights Technical Support
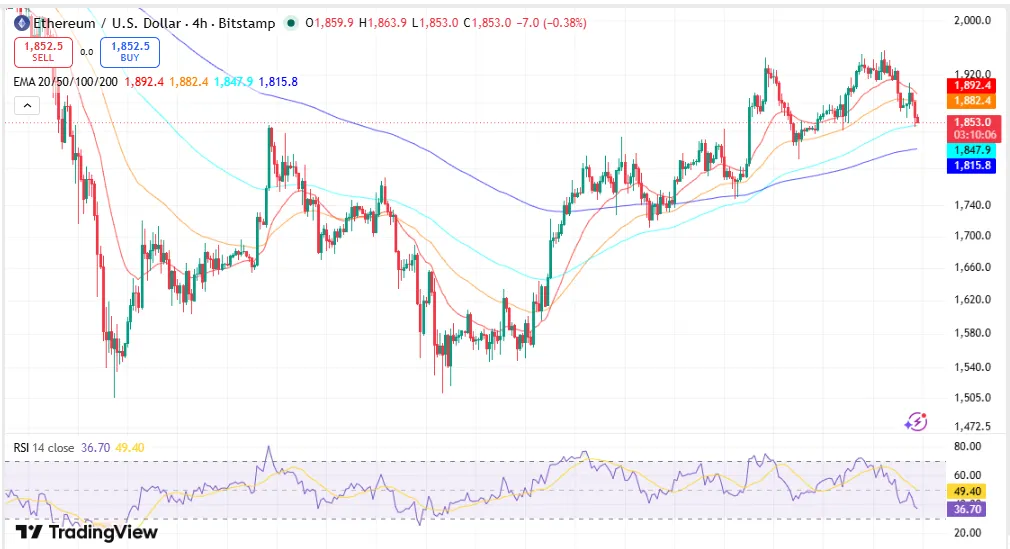
Ethereum continued trading around $1,883 on the four-hour chart after declining by approximately 0.57% during the day’s trading session. Despite having experienced losses in the session, it was above its 50 EMA, 100 EMA, and 200 EMA.
Ethereum had the 20 EMA level of $1,900 as its significant immediate resistance point after dropping from the $1,940 level. Besides, the 50 EMA level of $1,885 was a support point for Ethereum. This was followed by 100 EMA and 200 EMA levels of $1,848 and $1,815, respectively.
Source: Trading View
Other momentum indicators such as the RSI moderated to 44.9, reflecting moderate buying pressure and no overselling of the coin. Bollinger bands revealed that Ethereum was trading between a resistance level at $1,914 and a support level at $1,872.
Technical Notes of Importance
- Ethereum holds steady above the 50, 100, and 200 EMAs and maintains the overall trend.
- RSI reading of 44.9 indicates reduced momentum but not overbought conditions.
- The Bollinger Bands set an immediate resistance level of $1,914 and support level of $1,872.
Support and Resistance Continue to Influence Market Movement
An additional technical analysis identified Ethereum within a trading range. The closest support level was at $1,801 and resistance at $1,956.
Ethereum had been moving back down from its previous resistance level, but it was still holding well above its lower support level. Using Fibonacci retracement, we see that Ethereum has been stabilizing following its recent retracement, where sellers are still defending their support levels even though price is still below those retracement levels.
Market cap had reached an approximate value of $227.45 billion, while daily trading volume increased by 5.4% to $10.11 billion.
| ETH Market Data | Summary |
| Present Price | $1,884.75 |
| One-Day Change | -2.27% |
| Market Capitalization | $227.45 Billion |
| Volume in One Day | $10.11 Billion |
| Important Support | $1,801 |
| Important Resistance | $1,956 |
| RSI (4H) | 44.9 |
Price of Ethereum and the Performance of ETFs and Derivatives
The latest figures of the Ethereum spot ETF until July 23, 2026, indicate that there is now a return of positive net flows from the previous net outflows. There have been more positive inflow days than negative days recently
Nevertheless, ETF inflows were lower than the significant peaks recorded in mid-2025, implying that there has been an increase in institutional demand, but the levels are not as high as previously seen.
Derivative data continued to show active engagement.
The long to short ratio of Binance’s ETH/USDT is 2.23 and that of OKX is 1.64 indicating the presence of more longs than shorts on both exchanges.
On the other hand, total liquidations were $73.98 million within the past 24 hours, with $49.85 million in long liquidations and $24.13 million in short liquidations. In the past four hours, short liquidations were $18.46 million, which is higher than long liquidations.
Market Activity Snapshot
- ETFS spot flows have become positive again from prolonged outflows.
- Long-to-short ratios are above 1.0, indicating a greater number of bulls on the market.
- Open interest has been steady in the mid-$20 billion area despite prior reductions.
Ethereum open interest has also seen a continued gradual recovery after surpassing $60 billion in the previous rally. Despite ETH trading below previous peaks of the cycle, there is still activity in derivatives trading.
Analyst Identifies Crucial Support Area
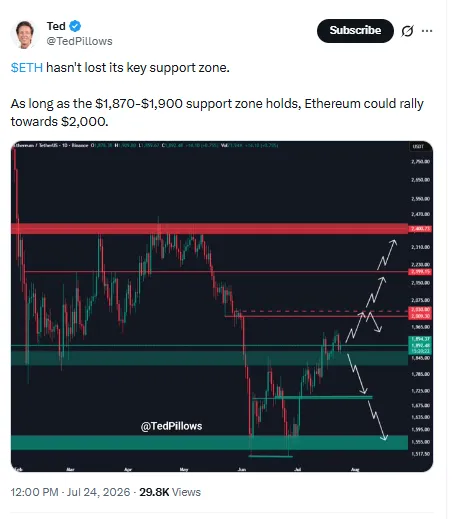
Crypto analyst Ted Pillows noted that the $1,870-$1,900 level was the main support level for Ethereum.
Source: Crypto analyst Ted Pillows
Moreover, according to the analysis, sustaining this area will help maintain the market structure that is currently prevailing and also create an area for an eventual recovery to $2,000 with resistance at $1,950.
The analysis further revealed another scenario in which a breakout of the support level would present other lower areas of demand such as $1,700 and eventually $1,550.
Frequently Asked Questions (FAQs)
Where does Ethereum currently find support?
The next level of support for Ethereum would be at $1,801, while analyst Ted Pillows suggests that Ethereum finds its primary short-term support at the $1,870-$1,900 range.
Where is the resistance for Ethereum?
Short-term resistance stands at $1,900-$1,914, and medium-term resistance at $1,956.
What does ETF flow suggest about Ethereum?
According to recent data, Ethereum ETFs have witnessed a return of positive net inflow after several months of negative flow.