
- The price forecast of Shiba Inu will still be based on Bitcoin, as SHIB manages to hold support under major EMAs.
- SHIB managed to stay under the resistance point despite low burn rates and increased wallets while maintaining limited supply on exchanges.
- Bitcoin is currently trading within a range and Shiba Inu could move according to the upcoming decision period nearing July 26.
The Shiba Inu price forecast continues to remain dependent on resistance and cryptocurrency market conditions after the meme coin continued its downward trend for the short term while maintaining itself below its moving averages.
While the bulls managed to defend one key intraday support region, there was little change in the technical picture, where resistance was accumulating across several metrics. Meanwhile, the on-chain numbers reflected slowing burn as well as a renewed increase in wallets following an odd spike.
Shiba Inu Price Forecast Hints at Key Resistance Regions
The Shiba Inu is currently being traded around the price of $0.000004123, marking a drop of 2.05% during the last 24 hours. However, during that timeframe, trading volume increased by 5.74% to $52.28 million.
The price held a market cap of around $2.42 billion, thanks to a supply of 589.24 trillion SHIB. The price chart revealed that there were some attempts to force SHIB down from around $0.000004214 as the buyers tried to hold the price at $0.00000412.
Market analyst LuckSide Crypto noted that SHIB currently occupies its lowest market ranking since the asset briefly entered the cryptocurrency top ten during its previous market cycle, when its market capitalization exceeded $50 billion.
Technical indicators continued to reflect downward pressure. On the daily chart, the asset was trading under all important EMA lines; all the EMAs had been trending downward.
The closest resistance continued being represented by the 20-day EMA at $0.00000435; then there would be 50-day EMA at $0.00000471, 100-day EMA at $0.00000522, and 200-day EMA at $0.00000626. Besides, there was still another bearish Supertrend resistance level of $0.00000467.
Intraday Chart Shows Consolidation After Recent Decline
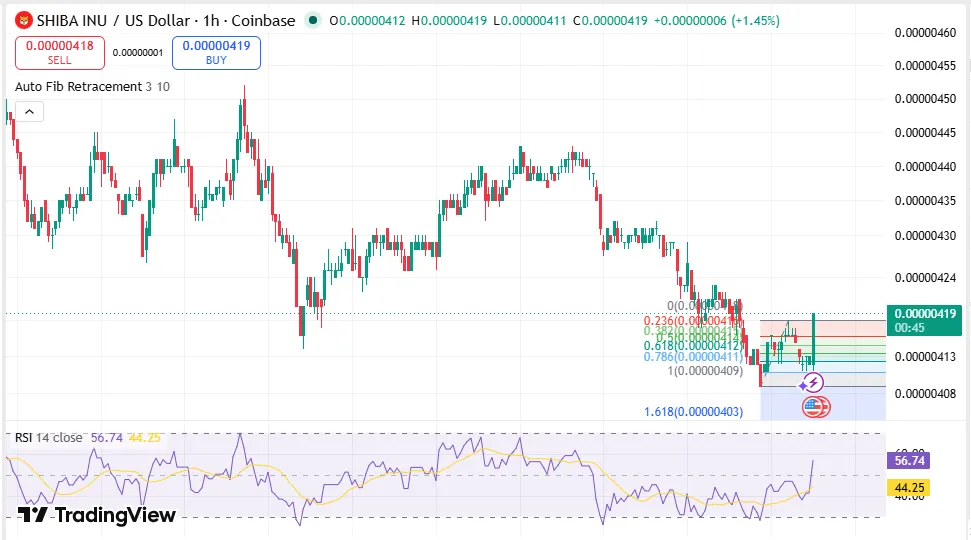
Trading on a short term showed a more balanced market. One-hour SHIB/USD chart was showing the price consolidating at $0.00000413 after recent selloff.
Fibonacci retracement analysis revealed the presence of immediate resistance at levels of $0.00000415 – $0.00000418, with support staying around $0.00000411. While the coin made some recovery off the lows of the day, it was still unable to rise above the primary retracement resistance area.
Source: Trading View
Indicators of momentum also stayed under pressure, with RSI staying close to levels of 41 and thus confirming low momentum, although there was a slight bounce back from oversold territory of early trading.
Any breakout above the 0.382 retracement level will remove one local resistance. Failure to hold the support near $0.00000411 will make SHIB vulnerable to further selling pressure in the trading range.
Overview of SHIB Technical Indicators
| Indicator | Value | Indication |
| Current Price | $0.000004123 | Trading around short-term support level |
| 24-Hour Change | -2.05% | Bearish trend on daily basis |
| Market Capitalization | $2.42 Billion | Constant market capitalization |
| 24-Hour Volume | $52.28 Million | Increase by 5.74% compared to previous day |
| RSI (1H) | 41 | Weak momentum with recovery |
| Immediate Support | $0.00000411-$0.00000412 | Buyers are defending this range |
| Immediate Resistance | $0.00000415-$0.00000418 | Fibonacci level of resistance |
| 20-Day EMA | $0.00000435 | First major resistance |
| 50-Day EMA | $0.00000471 | Secondary resistance |
| 100-Day EMA | $0.00000522 | Extended resistance |
| Supertrend | $0.00000467 | Bearish trend remains active |
Token Burn Activity Falls Even as the Token Holders Increase
The numbers from the on-chain metrics suggested an ambiguous scenario regarding the future SHIB price forecast.
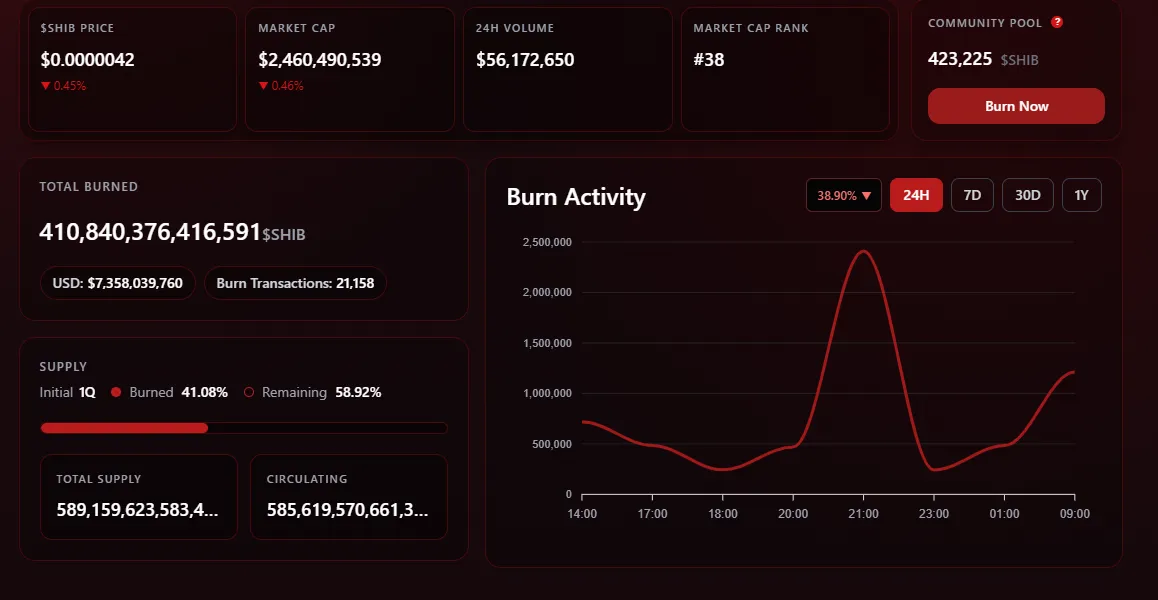
This was because weekly token burn activity was down by 82.69%, falling from around 110 million SHIB burned on July 8 to zero by July 14. This rise was brief as token burn volumes fell back to the usual flat values seen for most of 2026.
Source: SHIB
However, Over 410 trillion SHIB tokens have been burnt out of circulation, accounting for 41.08% of the total supply of the token. Exchange balances also stayed near their all-time lows, implying that fewer tokens were available to be sold on the exchanges.
The number of wallets was improving slowly following a weird rise in just one day which affected recent numbers. According to LuckSide Crypto, the recent jump probably wasn’t natural organic growth for the network. Most recently, wallets had risen by about 1,000.
Bitcoin Movement Could Determine SHIB’s Next Move
Market-wide conditions were still playing a role in shaping the future SHIB price prediction.
Bitcoin was moving in a range between $62,000 and trendline resistance.Until Bitcoin exits its current trading range, the wider altcoin market lacks a confirmed directional catalyst.
At the same time, geopolitical developments continued contributing to uncertainty across financial markets. UK’s approach to categorizing the IRGC of Iran as a terrorist group, as well as rising pressure from the international community with the involvement of western countries, Gulf nations, and China, was part of the larger macro environment which had an impact on risk assets.
LuckSide Crypto noticed the formation of a descending wedge pattern in the daily chart of SHIB. This is because of the narrowing trading range of decreasing resistance line and increasing trendline support level.
Important Price Levels for Tracking
Technical price levels are very clear at the moment.
| Price Level | Price |
| Primary Support | $0.00000412 |
| Secondary Support | Lower trendline |
| Fibonacci Resistance | $0.00000415-$0.00000418 |
| 20-Day EMA | $0.00000435 |
| Supertrend | $0.00000467 |
| 50-Day EMA | $0.00000471 |
| 100-Day EMA | $0.00000522 |
| Downside Target if Support Fails | $0.00000380 |
Under the existing technical framework, the bullish scenario would depend on Bitcoin being able to break its consolidation ahead of the anticipated window on July 26, allowing SHIB to climb above the 20-day EMA line and possibly challenge the 50-day EMA at around $0.00000471.
In case of the bearish scenario, Bitcoin will have failed to break past long-term resistance and SHIB will fail to hold its support on the lower trendline, sending price towards $0.00000380, whereas the descending moving averages keep serving as resistance throughout the entire period.
At present, the SHIB price forecast remains focused on the technical levels where the price continues to range within well-established support and several resistance levels.
Frequently Asked Questions
Why is Shiba Inu trading below its critical moving averages?
As per the daily chart, SHIB is currently trading below its 20-day, 50-day, 100-day, and 200-day exponential moving averages. These indicators continue to move downwards as prices have not yet been able to cross above significant levels of technical resistance.
Which is the most critical support level for SHIB?
According to the current price movement, SHIB sees immediate support at $0.00000412, with another level of support coming from the lower trendline as shown on the daily chart.
Which resistance level must be kept in mind by traders?
Traders need to watch out for the 20-day EMA level at $0.00000435. In addition, resistance can be seen at $0.00000467 in the Supertrend indicator, $0.00000471 in the 50-day EMA, and $0.0000052.