- Shiba Inu cryptocurrency is trading below key resistance levels as sellers succeed in dominating amid large burns of tokens during the week.
- Robinhood has burnt more than 109 million SHIB tokens, and the burn rate increased significantly by more than 3000%.
- SHIB tokens remain above crucial support levels amid trader anticipation for either a breakout or a breakdown of SHIB.
Shiba Inu Price Prediction got affected by some on-chain events, along with the sell-off occurring in the Shiba Inu crypto market. On July 8th, Shiba Inu Price Prediction became an urgent issue owing to the decline in SHIB and massive increases in burns.
The memecoin traded at $0.000004168, down 4.6% over the previous 24 hours, while technical indicators continued to point to a market trading below major resistance levels.
At the same time, on-chain data showed more than 117 million SHIB removed from circulation in a single day, producing the largest daily burn recorded in six months.
Nonetheless, derivatives measurements showed that traders were de-risking and not taking on new leveraged trades, meaning that the focus remains on whether the current levels of support will halt further losses or if the current burning phase can aid in building renewed buying pressure.
Shiba Inu Price Forecast Points to Further Technical Pressure
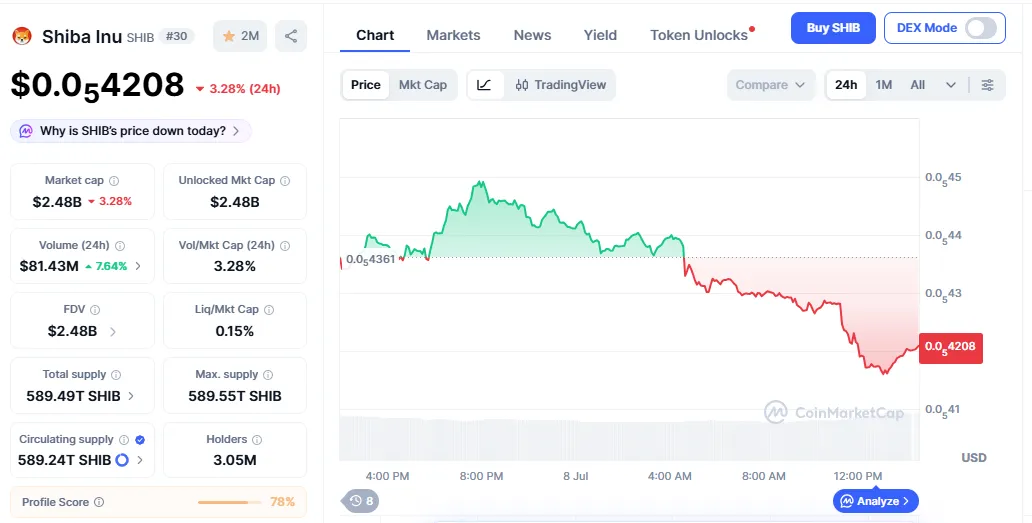
The daily trading activity for SHIB shows sustained selling pressure despite the initial rally. CoinMarketCap data showed the token briefly climbed toward $0.00000445 before reversing lower, with losses accelerating during the latter part of the trading session.
Source: Coinmarketcap
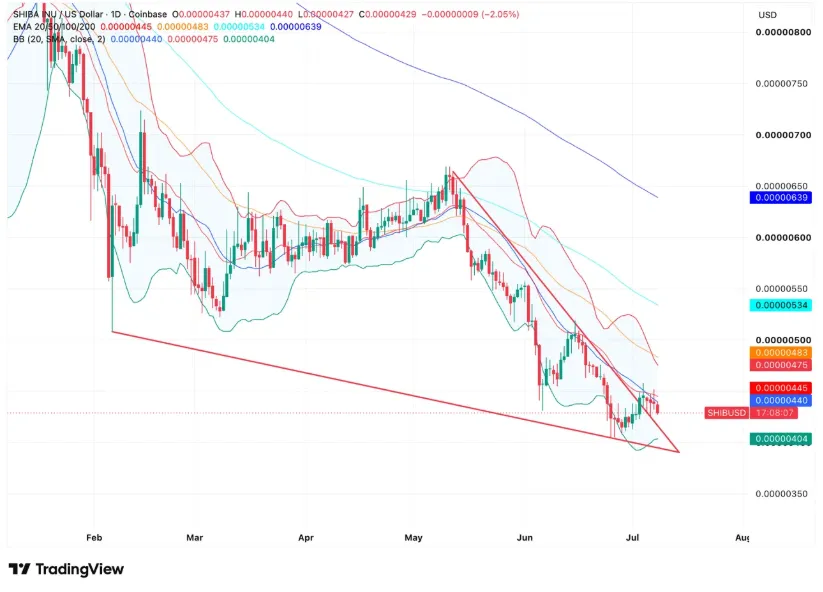
The broader daily chart continued to display a descending triangle that has remained in place since May. Lower highs continued to form against a relatively flat support zone between $0.0000040 and $0.0000042, keeping price compressed inside the pattern.
Volatility also narrowed considerably. Bollinger bands became tight to one of the narrowest readings in months, with the upper band located at $0.00000475 and the lower band at $0.00000404.
Such a narrowed reading of Bollinger bands showed a decrease in price volatility and prepared the market for a bigger move after the consolidation is over.
Moreover, the trend indicators were consistent in showing a downward momentum. SHIB was trading below each of the important exponential moving averages:
| Indicator | Level |
| 20-day EMA | $0.00000445 |
| 50-day EMA | $0.00000483 |
| 100-day EMA | $0.00000534 |
| 200-day EMA | $0.00000639 |
The position of each moving average above the current price showed that the existing trend did not change throughout the reporting period.
Support and Resistance Levels Determine the Next Step
Existing technical levels will form the basis for the short-term movement of prices.
The first support level will remain close to $0.00000404, while the lower Bollinger Band coincides with it.Below that sits the lower boundary of the descending triangle around $0.0000040, an area that has repeatedly attracted buying interest during recent weeks.
Source: Trading View
On the upside, the first resistance is located near the 20-day EMA at $0.00000445. Further resistance may be seen at the level of $0.00000475, which corresponds to the top Bollinger Band and the upper limit of the current trading range.
They still remain the closest levels watched by the traders as SHIB continues to trade within its current structure on the chart.
Technical Levels
- Support: $0.00000404 then $0.00000400
- Resistance: $0.00000445 then $0.00000475
Robinhood Burn Rate Leads to Increase in SHIB Burns
On-chain information revealed that there was an increase in the amount of tokens burned in the recent session.
According to Shibburn, a wallet belonging to Robinhood sent 109,659,248 SHIB to the dead wallet in one single transaction. Two other transactions of about 460,000 SHIB each came from the same sender.
The combined activity pushed total daily burns above 117 million SHIB, making July 8 the largest single-day burn recorded in approximately six months.
The burning stats were accompanied by a significant increase in metrics for activities. The burning rate per 24 hours was increased by 3,096.85%, while the burning rate for seven days was increased by 680.07%. Charts for burning demonstrated that activity was quite flat before 01:00 when there was an abrupt growth of activity.
The transactions are consistent with fee structures used for collecting trading fees through the destruction of tokens.
Although the burning rate increased, the statistics concerning supply is not affected much because more than 410.84 trillion SHIB have already been burned since 2021, while the total supply of circulating coins exceeds 585 trillion SHIB.
Derivative Market Position is Declining Consistently
Changes in the Shiba Inu price prediction were consistent with changes in derivatives positions.
There was a rise in trade volume by 11.78% to $95.45 million and a decline in open interest by 1.44% to $28.75 million within the past 24 hours. It means that the difference between the increased trade volume and decreased open interest shows that there was closure of old positions without adding new positions to the market.
Moreover, the long to short ratio was $0.9482. The liquidation data also indicated very little upward pressure. The total liquidations amounted to $111.93K, where long positions were $109.17K while short positions were just $2.75K.
Long-term derivatives data showed that this is the general trend. Open interest has dropped by 94% from close to $500 million seen during early 2025 to $28.75 million, the lowest point in almost two years.
Shiba Inu Price Prediction: Upside & Downside Targets
Technical setups at present can give us two main situations according to the current price interaction with the current triangle formation.
If there are increased buying activities with SHIB crossing the descending trendline along with its move back to the 20-day EMA at $0.00000445, the subsequent targets can be expected to range from $0.00000475 to $0.00000500.
However, on the other hand, if the lower side of the triangle near $0.0000040 loses support, the subsequent targets can be expected to range from $0.00000350.
FAQs
Why is the SHIB price going down today?
The SHIB price fell amid persistent selling activities in the market even with an uptick in token burn activities. There were also technical signs showing the token trading below all important exponential moving averages, with derivatives showing traders exiting rather than opening trades.
What are the important levels of support and resistance for SHIB?
The nearest levels of support are at $0.00000404 and $0.00000400. The level of resistance can be found near the 20-day exponential moving average (EMA) at $0.00000445 and above that near the upper Bollinger Band at $0.00000475.
How many SHIB tokens were burned on July 8?
Over 117 million SHIB were burned on July 8. A Robinhood associated wallet made the largest single transaction where more than 109.6 million SHIB was burned.