Key Insights:
- XRP was stuck in the range between $1.3930 and $90B market cap resistance and it was rejected many times, which proved that it was highly sold.
- The momentum indicators remained poor, RSI was around 48 and flatening MACD, indicating a lack of purchasing power and market uncertainty.
- Long-term consolidation in a narrow band was an indicator of a build up period, which would be followed by a major break out or break down.
The recent perspective on XRP by Ali Martinez has been reaffirmed, and he says that the common cross-border token can be in its stronger break-out phase.
The past few weeks have witnessed little activity in XRP, as the price is rather stable. On the monthly chart, activity has remained subdued, except for some definite rejections around the level of $1.60.
XRP Price Structure and Trend Behavior
XRP showed mixed-daily finishes as the price was trapped in a small trading range.The asset was in a compressed structure following a continued downward trend that began at the beginning of the year.
The price action created low highs on a downward trend line that capped upward action.This diagonal resistance was well respected in the market as every attempt to rally was unsuccessful at approximately the same levels.
Downside moves were in horizontal support zones, which inhibited prolonged breakdowns within the time frame observed.At one time, the price dropped sharply creating a long bottom wick that meant the price was well received.
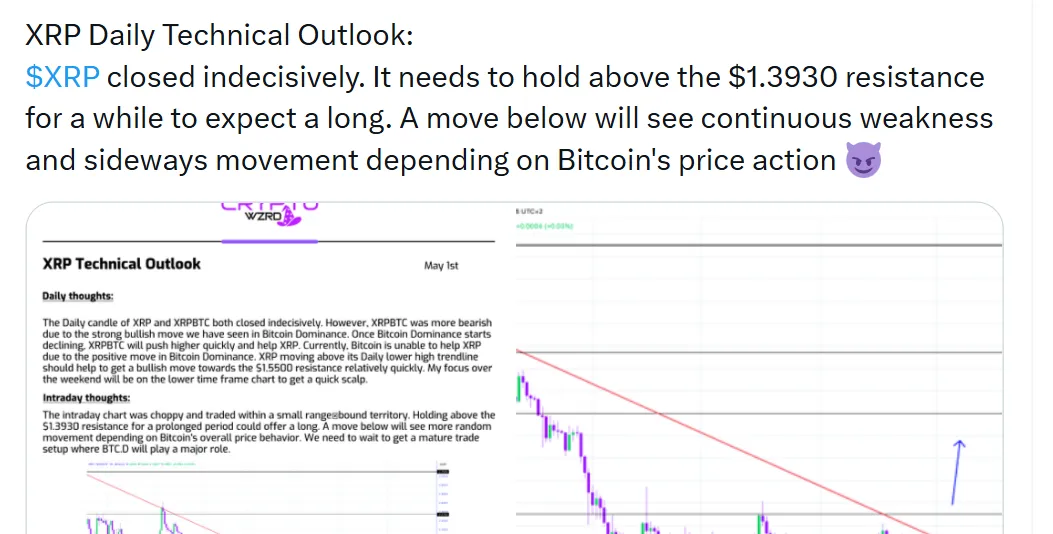
Following that, XRP settled and traded on both sides with less volatility and smaller candles.This consolidation period was an indication of balance between the buyers and sellers within a specified range.
The momentum was not strong because price was about the bottom of the descending resistance.The building had no reported breakout with candles still closing under the trendline resistance.
There were short-term fluctuations around the range with no clear directional bias.The larger trend continued to have a downward slope, despite the consolidation process.
Important Levels and Response in the Market.
The critical resistance level of about $1.3930 served as a critical level of resistance within the period under observation.
Price would come close to this level several times but was unable to achieve permanent movement above this level. Every rejection only made this resistance stronger and continued to press on bullish momentum.
Areas of support that were lower than the current price took on the selling pressure and did not allow the price to keep on decreasing. The market fluctuated within these limits, it formed a specific trade channel with a restricted growth.
Breaking above resistance also needed volume buying and multiple higher closes above the resistance. Inability to hold above resistance held price within the set range.
Declining below the support created more volatility and unpredictable price action. These movements matched larger market circumstances, whereby outside forces had an impact on the short-term orientation.
The price movement of Bitcoin helped XRP to maintain its stability as correlation had effects on overall market movement. Weaknesses in the overall market were also associated with decreased upward trend in XRP.
Price was also price-sensitive to macro trends, keeping abreast with the overall cryptocurrency trends.The consolidation process did not break decisively, maintaining the previous market structure.
XRP is firmly resisted at 90B during intraday consolidation.
On the intraday trading period, XRP moved in the sideways movement, with the market cap positioned at approximately $85.41B. Price fluctuated between a narrow range of 83B and 90B with a limited volatility. The session experienced a minor downward movement of 0.04, which is a poor directional movement. Volume of approximately $1.65B was close to price with the DEMA 9 at $85.25B.
The $90B resistance was a solid ceiling during the session. Price broke into the $88B-$90B zone on multiple occasions, and could not stick above it. Every rejection drove price back to the price level of $85B which proved that there is a strong selling pressure. Intraday highs were kept under resistance and the failed attempts to break the resistance were in a steady trend.
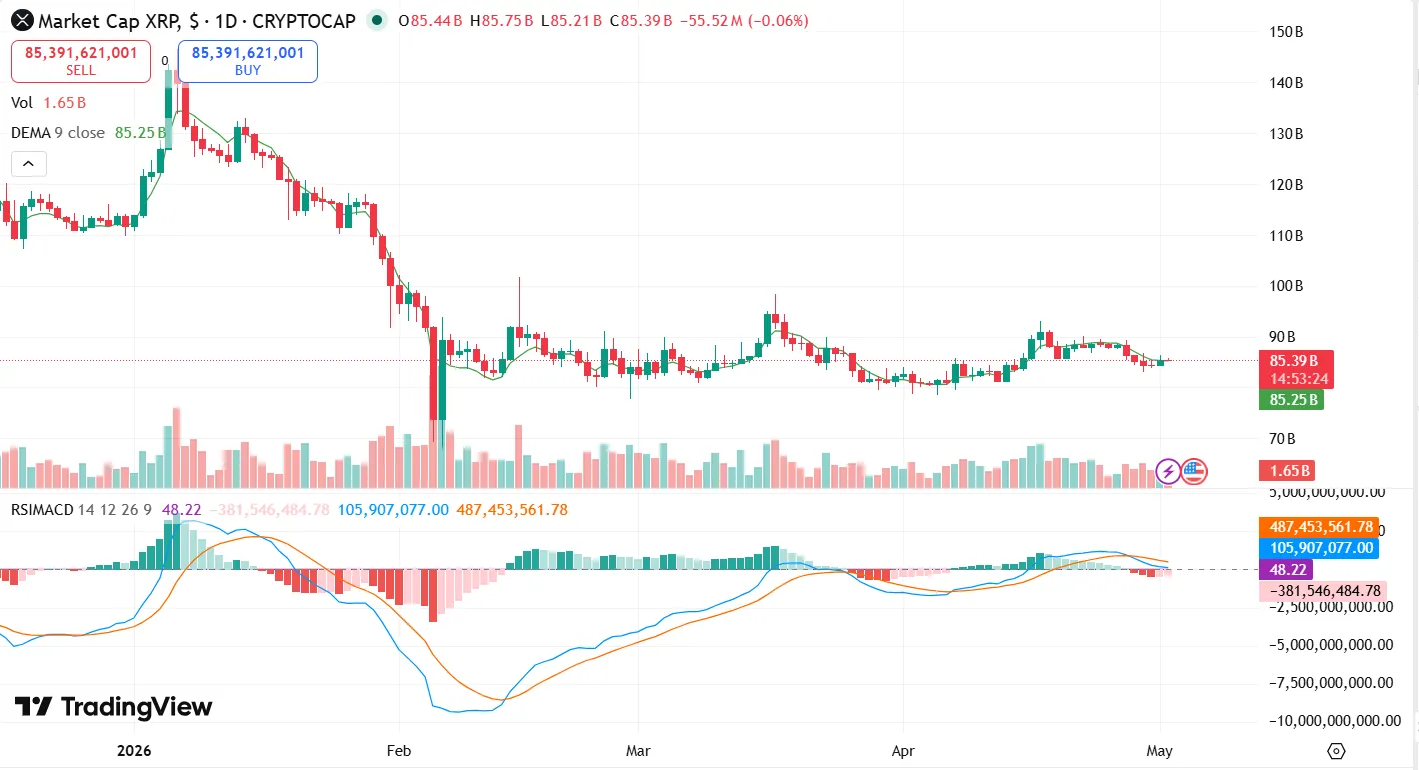
This consolidation was indicated by momentums indicators whereby the RSI was around 48.28, which indicated neutral strength. The MACD value of $107.38M and $487.74M show less momentum, although bullish posturing was minor. The histogram bars became flatter indicating low buying pressure. Price kept trading at less than the resistance, maintaining a limited intraday range.
Long-term Resistance Cements XRP because Consolidation is an indicator that could break out imminently.
Persistent Resistance Caps XRP as Consolidation Signals Imminent Breakout Potential
XRP was held within the range as it continued to face resistance around the areas of $1.3930 and the overall market cap limit at $90B. The constant rejections on these levels proved the high sell-side pressure and less bullish continuation.
The downward trendline was characterized by low highs which ensured downward structure and inhibited the formation of breakout. Dulled momentum signals such as RSI around 48, showed the lack of strong buying power and market indecisiveness.
This is important since long-term consolidation tends to lead to a major directional drift after a resistance or support break.
Market Impact
The limited circulation of XRP affected the mood in the entire crypto market, supporting a wary trading atmosphere.
Bitcoin correlation helped in stabilizing and the larger weakness restricted upward momentum on large assets.The repeated failures of resistance made traders emphasize on short-term ranges rather than long-term positioning.
Key levels continued to hold the liquidity, decreasing volatility and postponing trend growth.This action was an indication of a market that was awaiting greater impetus to make a firm step.
Conclusion
XRP continued to have a compressed pattern in both the daily and intraday basis with the levels of resistance remaining steady.Price kept trading within specified limits, with no confirmed breakout of over $1.3930 or over $90B.
The momentum indicators were in line with this tightening, showing less involvement and low direction bias.The market structure was not violated, and price was awaiting a definite spur to an upward continuation or further decline.
FAQs
1. What is the reason why XRP cannot break resistance?
The selling pressure around 1.3930 and 90B negated any prolonged upward movement.
2. What does the consolidation stage mean?
It represents equilibrium between buyers and sellers prior to a possible break out or breakdown.
3. What are some indicators that back up this trend?
RSI of around 48 and flattening MACD indicate a weak momentum and no aggressive buying action.
4. How did Bitcoin factor in the movement of XRP?
The weak yet steady trend of Bitcoin reduced the potential of XRP to experience an upward trend.
5. What is next to watch by traders?
The important levels are 1.3930 resistance and lower support areas to indicate a breakout or breakdown.