Key Insights
- Bitcoin is showing stiff resistance at around $74,500 with potential of breaking out.
- RSI and MACD indicators give neutral signs of the momentum in the market, and indecision.
- The support of approximately $73,800 is still important to the price stability in the short run.
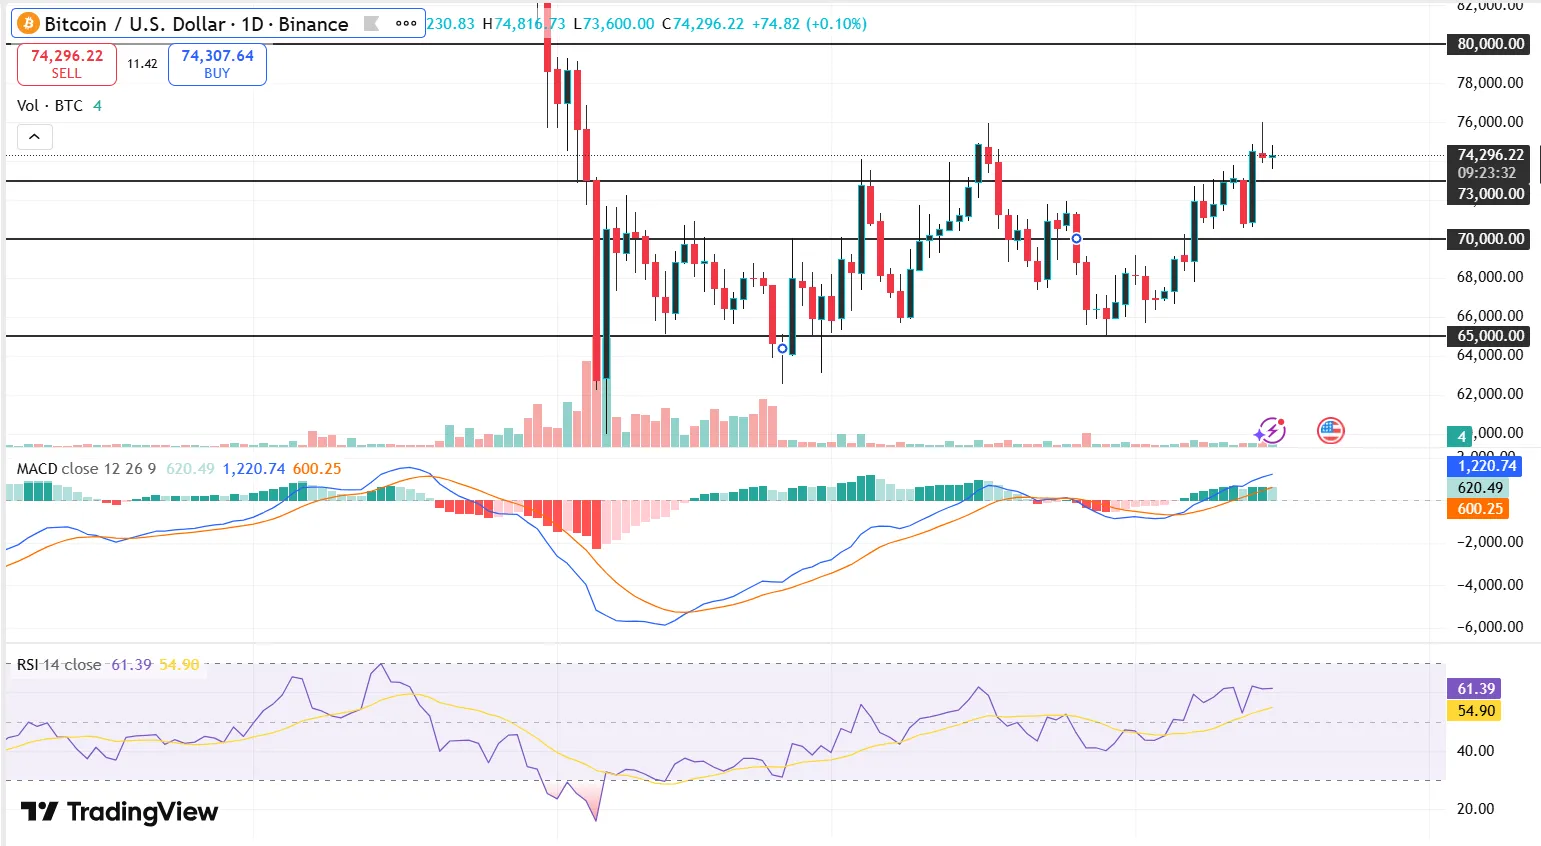
Bitcoin traded around $74,034, having tested intraday highs of between $74,517, with minimal directional conviction. Repeated rejection indicated by price action around the levels of $74,500 indicates that sellers are still active higher in the eye of recent sessions. The market failed to maintain an upward trend, as the earlier bullish actions, placing Bitcoin in a tight range of consolidation.
RSI indicators were at a range of 50 to 58 which indicates neutrality and no overbought or oversold indicators were forming. This range normally shows uncertainty, which in the short run neither the bulls nor the bears are in control of price movement. These levels were monitored closely by traders since a breakout over 60 would ignite fresh bullishness on the side of Bitcoin.
The MACD indicators displayed weak bullish crossover, but overall histogram bars were shallow and irregular. This trend can be a common indicator of a weaker trend strength and therefore Bitcoin can remain in the same direction unless it has the support of higher volume to push it in the direction of the trend. Both indicators are not very convincing, and traders are waiting to get more definite conclusions before they can venture into aggressive positions.
Bitcoin is capped on the upside by resistance.
Bitcoin has been unable to overcome the $74,600 resistance area again, which indicates its significance as a temporary ceiling. Any move around this amount was met with pullbacks, or high selling orders or profit-taking actions by traders. This trend indicates that Bitcoin needs a better purchasing force to surmount this obstacle in a convincing manner.
Support was established below the price of about $73,800 and the price went down slightly and then it had rebounded indicating the interest of buyers at lower prices. The rebound off the $73,600 previous also indicated a possible area of demand that could be aggressively defended by traders. Should Bitcoin retrace these levels, the market participants will be keen to ensure that the support is strong.
Any fall below $73,800 would open Bitcoin to additional downside till $73,600 or even lower intra-day prices. On the other hand, recapturing $74,500 with high volume would change the tide, and pave the way to the resistance of $75,000. Until there is such a breakout, Bitcoin will be confined within a specified range of trade, preventing short-term volatility spikes.
Short–term clues depict ambivalent signs in the future.
The RSI of Bitcoin remaining close to mid-levels indicates that there are no major imbalances in the market, with the buyers and sellers having a relative equilibrium. This sideways position usually comes before larger ones, since the period of consolidation usually ends with more decisive directional break out. Such arrangements are usually understood by traders as accumulation or distribution areas, based on the bigger market sentiment.
There was slight bullish divergence attempts seen on MACD lines, but momentum was not consistent enough to allow Bitcoin to continue trending upwards. The uncertain nature of the histogram is captured by the alternating trend, and it supports the point that neither party has achieved the upper hand. This indecision is in line with the sideways movement of the price that has been experienced during the trading session.
Volume activity was also moderate with no major upsurge as would be the case with breakout or breakdown conditions in the Bitcoin markets. When there is no large volume growth, the price movements are less predictable and more likely to reverse. Players in the market are thus on their guard awaiting the cues before engaging in directional trades.
Market outlook and possible breakout scenarios.
The prospects of Bitcoin in the near term are largely conditioned by the possibility to overcome the resistance zone of $74,500 and convincingly. An effective breakout might lead to the bullish trend, driving the price to $75,000 and maybe even more psychological levels. This would most likely need to be accompanied by higher volumes of trading and a long-term purchasing pressure of the institutional players.
On the negative, loss of above $73,800 can cause the sentiment to turn bearish, with retests of $73,600 supports. Bitcoin might temporarily fall below this range, then discover more robust demand areas should the selling pressure increase. These moves are often viewed as liquidity hunts by traders in range-bound markets, ahead of potential reversals.
In general, Bitcoin is in a state of consolidation, which can be understood as a market waiting to be triggered by some catalysts like macroeconomic or institutional flows. Traders are likely to experience further sideways movement with volatility spikes now and then until a decisive breakout. The technical set-up in this environment is more conducive to short-term strategies, than long-term bets on a directional basis.