Key Insights:
- Bitcoin faces mounting downside pressure as rising oil prices and inflation fears weaken market sentiment.
- Liquidity data indicates a potential sweep toward $65,000 and possibly lower support zones.
- Bearish technical patterns project downside targets ranging from $50,000 to $41,000.
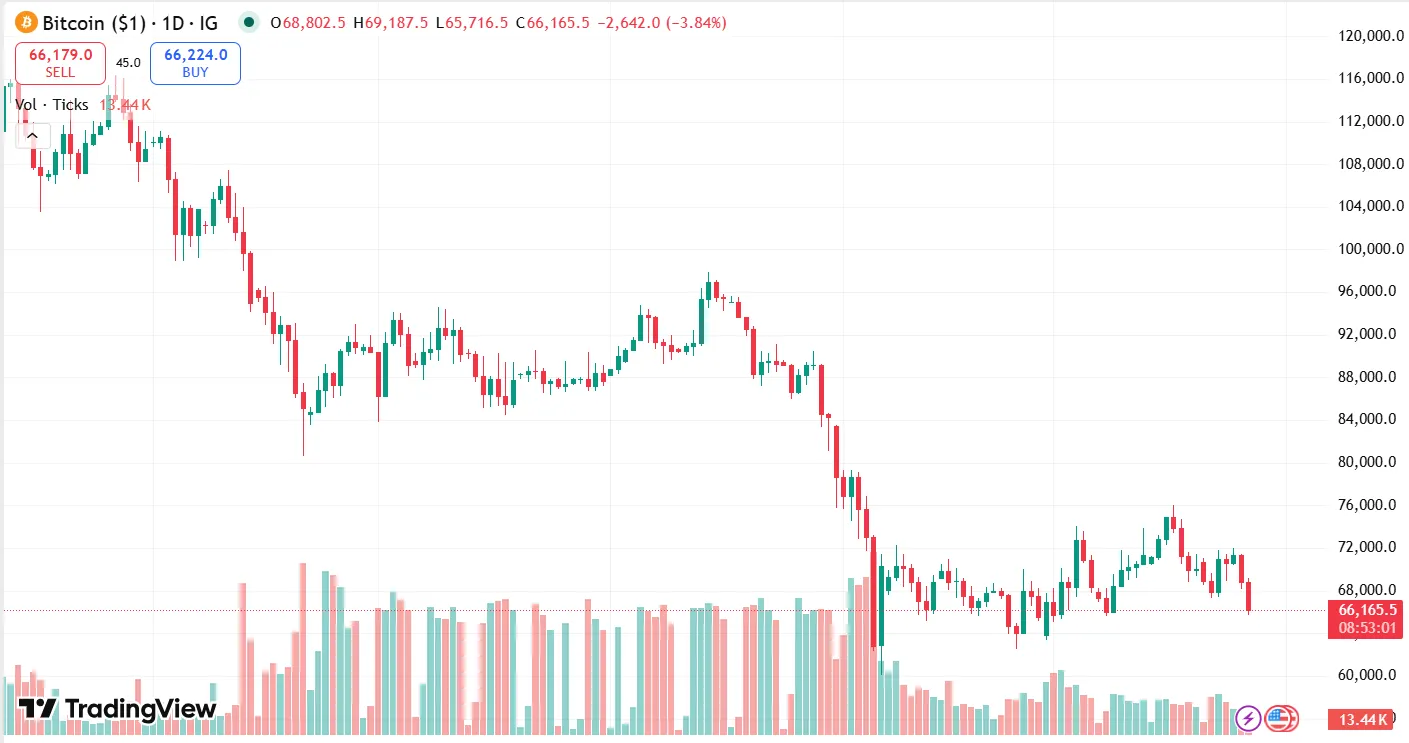
Bitcoin fell ahead of the open of the Wall Street and dropped below the level of $66,500 as the downward pressure continued to grow. According to market statistics provided by TradingView, Bitcoin remained moving towards range lows, and traders were paying attention to the areas of significant support.
Concurrently, the U.S. stock futures traded down and crude oil prices were nearing at $97 per barrel; this indicates the ongoing geopolitical tensions. These macroeconomic trends increased pressure on risk assets, and Bitcoin responded to greater uncertainty in the financial markets of the world.
According to liquidity data provided by CoinGlass, the majority of orders were clustered around the level of $65,000 and the highest level of order was capped at about $70,000. The lack of liquidity indeed held Bitcoin in a tight band, where the resistance was already known by traders previously.
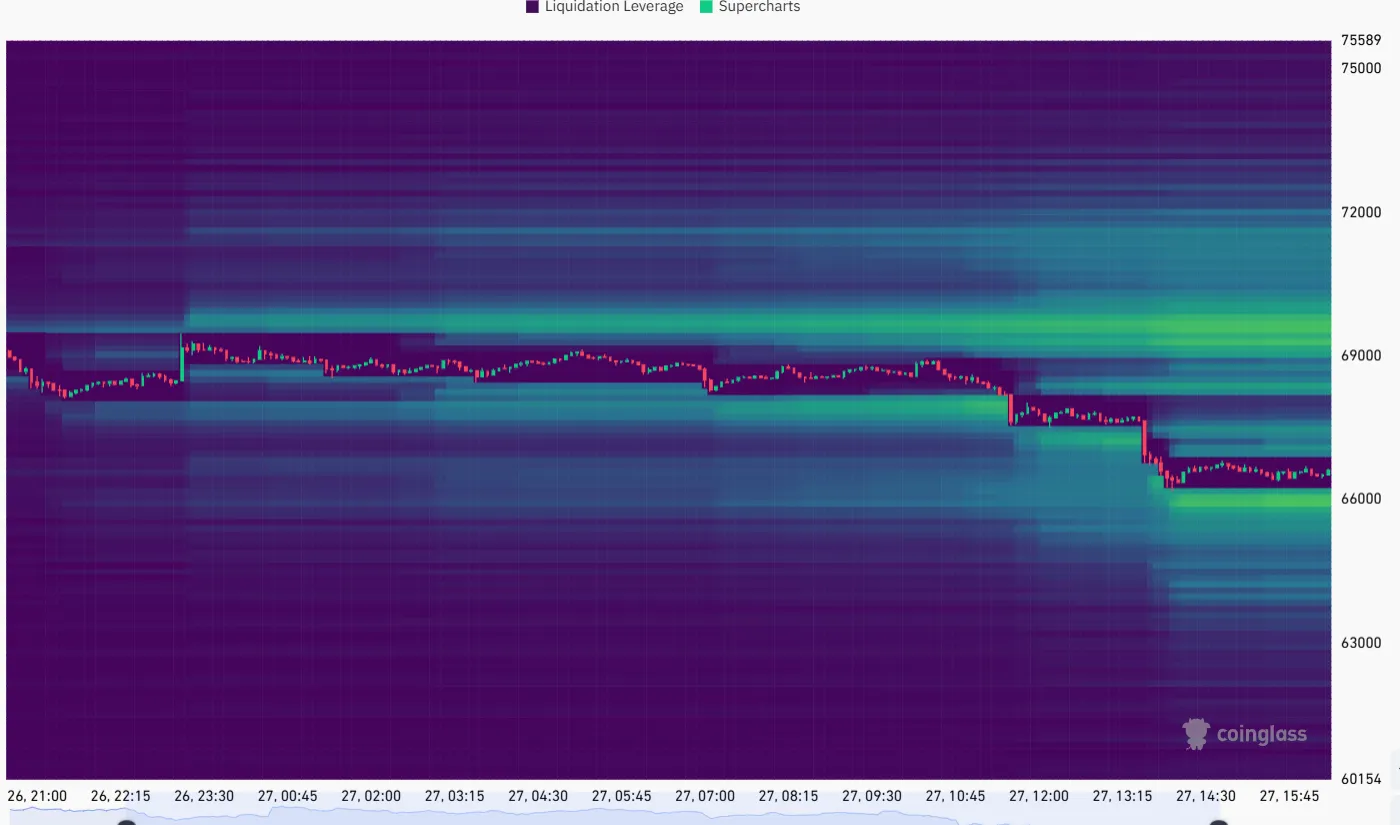
Liquidity clusters signal downside risk continuation
The market participants saw that Bitcoin was keeping on taking liquidity at a low price than the present price, which indicated that it could drift towards low support areas. Analysts have observed that these kinds of liquidity structures are not common in the market bottoms which means that the downside can further unfold.
Crypto trader Jelle confirmed that the $70,000 to $71,000 range remained firm resistance, limiting any immediate bullish recovery attempts. He added that the accumulation of liquidity below current levels increases the probability of a sweep toward those zones.
Michaël Van de Poppe also stated that additional weakness into the monthly close would not be unexpected under prevailing market conditions. He emphasized that a sweep of recent lows could create buying opportunities, particularly within the lower $60,000 range if reached.
Bearish patterns point toward deeper correction levels
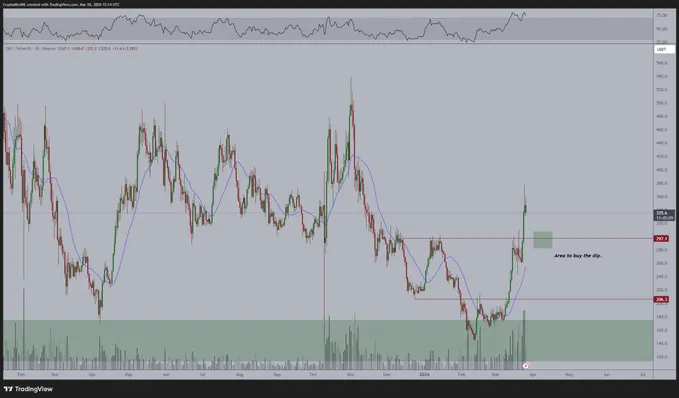
On larger time frames a developing bear flag pattern that kept influencing Bitcoin price action in recent sessions was in the interest of analysts. This trend has been observed in the past in earlier years in 2026 and it has been known to generate strong downside targets under important support.
Traditional trader, Peter Brandt, pointed out the development of a rising wedge with a bearish shape in the good technical analysis. This arrangement added to the fears that Bitcoin could not be able to sustain the current levels of prices without a powerful impetus.
According to a trader Aaron Dishner, Bitcoin had already fallen beneath a major cloud signifier on the 24-hour chart, which proved declining momentum. He added that the measured move from previous highs and lows projects a downside target near $41,000 if the pattern fully develops.
Oil surge and inflation fears impact Bitcoin
The oil price increase has now become one of the key determinants of the Bitcoin and the overall financial markets as various supply interruptions still impact the energy supply across the world. Inflationary pressures would increase in the global market with some estimations showing that the crude oil might reach as high as $180 per barrel.
The cost of energy will increase, which will drive U.S. inflation to a higher than 5% level, diminishing the risk of interest rate reductions in 2026. This situation puts Bitcoin in a difficult position since with stricter monetary rates, risk-sensitive assets are normally undermined.
The broader market reaction has already become visible, with U.S. equities declining and bond yields rising sharply across major economies. Technology stocks, including major firms, have recorded notable losses, reflecting reduced investor appetite for growth-oriented investments.
Bitcoin outlook hinges on macroeconomic developments
Bitcoin is also down almost 9.5% of its recent high of $76,000 and currently trades below the critical level of $70,000. The decline also pushed Bitcoin below the 200-week EMA at about $67,400 which many long-term investors closely watch.
The derivatives data showed that more and more people are seeking put options in the range of $50,000 to $60,000 which means that traders are hedging against downside risks actively. Such positioning is based on the anticipations that Bitcoin may return to lower levels in the event that the environment of macroeconomic is not favorable.
Although this bears a bearish view, other analysts still hold a longer-term bullish view with institutional demand and inflows attributed to ETF being supportive factors. The Standard Chartered Geoffrey Kendrick estimated that in the normal course of economic events, Bitcoin will hit $100,000 by the end of the year.
The next several weeks will be the last critical ones since the geopolitical situation is analyzed by markets and how it affects oil prices and the tendency of inflation. Any reduction in the world tensions would favour recovery and any further USpheavals might drive Bitcoin to even greater levels of corrective measures.