Key Insights:
- Shiba Inu faces rising selling pressure as long liquidations dominate, weakening bullish momentum and increasing short-term downside risks.
- Mid-band support near $0.00000584 remains critical for determining price direction.
- Weak Bull Bear Power signals highlight limited buyer strength despite a slight positive bias.
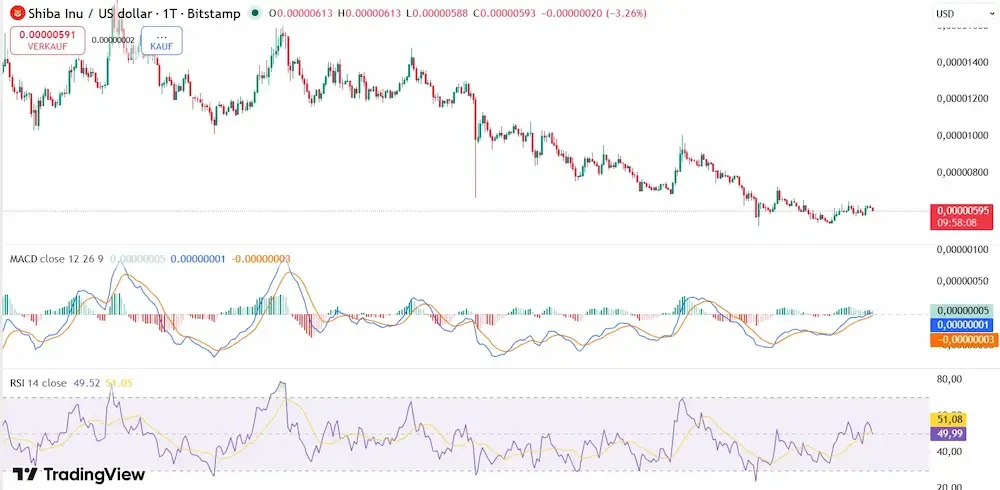
Shiba Inu is showing signs of weakening momentum as selling activity increases, pushing the token toward a crucial short-term support level.At the time of writing, Shiba Inu is trading at $0.00000595 which is a -2.94% change in the last 24 hours.
The daily chart shows that there is a continual intraday depreciation of the $0.00000611 zone to the $0.00000595 zones, which proves the presence of a persistent bearish trend.The price action has still been in the pattern of lower highs and lower lows, with sellers taking control most of the time after a short-lived stabilization around the bottom of the daily range.
Although the performance is weak now, the expanded performance shows ambivalent indicators with profit of 3.2% and 4.6% in 7 and 14 days respectively.This puts Shiba Inu in a precarious position and a recovery will propel it back on track and a collapse will drive bearishness further.
 Mid band support remains critical or bulls
 Mid band support remains critical or bulls
Shiba Inu is almost at a significant technical point of the 20-day Bollinger Band basis, which is currently at about $0.000005844.
This is because it is a dynamic support along the middle area of the band and thus obligatory to the bulls trying to support the existing structure.
Any further increase would show that Shiba Inu is still slightly bullish compared to its average trading in the recent past.Nevertheless, the recent candles indicate uncertainty indicating that buyers are not strong enough to initiate a strong upward trend.
In case of weak support, the selling pressure may increase, which would open the token to larger losses in its larger trading band.This level is being carefully monitored by traders because the result of this level may dictate short-term direction.
Shiba Inu price analysis signals weakening momentum
Shiba Inu is still inside the top half of its Bollinger Band, and its resistance is close to $0.000006358, but its support is close to $0.000005330.This position indicates that although the token has not yet completely lost bullish structure, it has not been able to make a breakout.
Short-term resistance is close to $0.00000610, which should be retaken to assure fresh purchasing power and prospect of recovery.Negatively, the inability to secure mid-band support may drag Shiba Inu down to the levels of $0.00000533 and put the downside risk at risk.
The existing market structure bears an indication of a market that is not very convinced, and both customers and traders are cautious during the past few sessions.This hesitation is almost always followed by the volatility that implies that a more drastic price movement might take place after a verified breakout or breakdown.
Bull bear indicator shows limited buyer strength
The Bull Bear Power indicator is still marginally positive with a standing of about $0.000000182 which means that the buyers still have a slight edge.But the histogram values are not so high implying that the bullish momentum is there but not strong.
This low purchasing power raises questions of the sustainability of any short term recovery particularly as the selling power is accumulating at a slow rate.To build a positive momentum again, Shiba Inu would require buyers to purchase in volume and drive the indicator upwards.
The market is prone to further decline, especially when the sentiment of more people turns negative until it is reinforced stronger.The existing equilibrium between the buyers and sellers indicates a weak market structure.
Shiba Inu Long Positions Drive $73K in 24-Hour Liquidations
The liquidation information of Shiba Inu illustrates its steady growth through all periods of time being tracked, with the majority of the losses being long positions.The one-hour liquidation amount is of $4.30K all of long, and short liquidations are zero.
The liquidation total of 4 hours is to be 25.84K with long liquidations of 23.11K and short liquidations of 2.74K.The liquidation total of twelve hours shows 48.67K, the long positions 45.72K, and the short positions 2.94K.
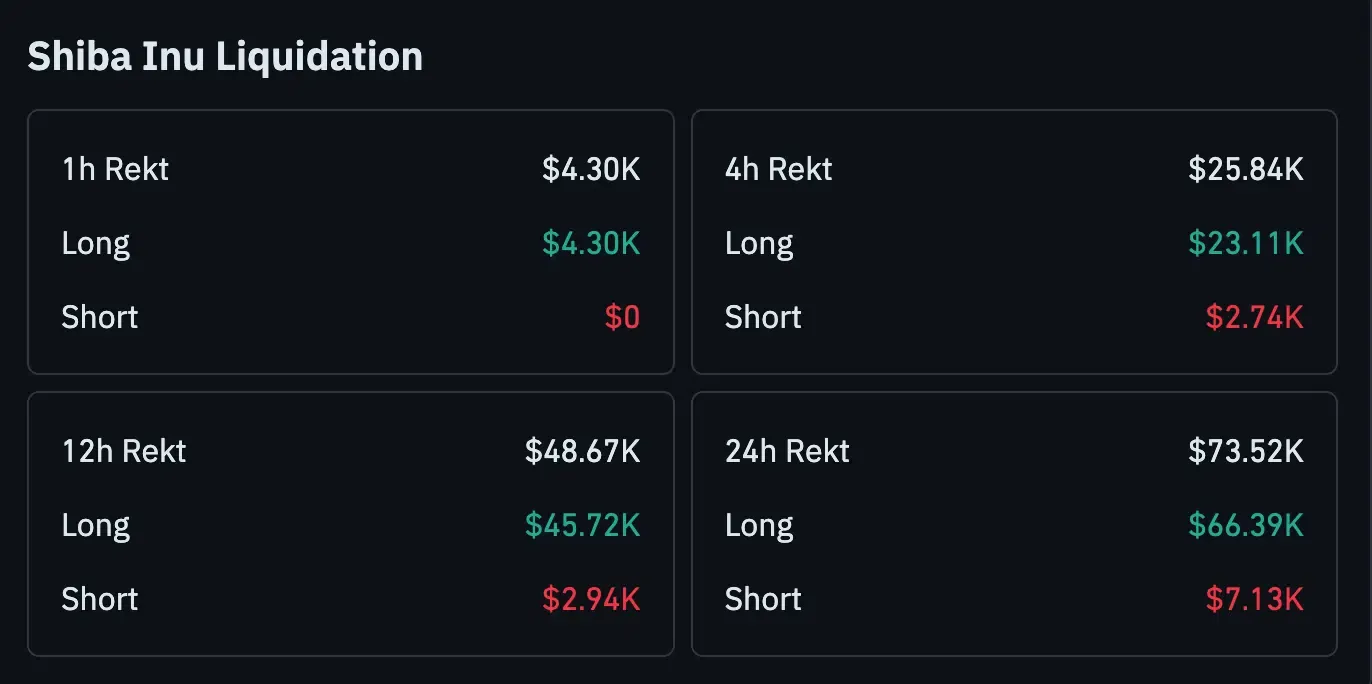
The total liquidation 24 hours upsurge up to $73.52K, long liquidations are at 66.39K, and short liquidations are at 7.13K.The long liquidations always prevail over all periods and this means that the upwardly position traders suffer the greatest losses.
Short liquidations are in lesser quantities, and it is not during the hour that any activity was registered.The liquidation values are on a cumulative pressure in the market as the shorter durations have high liquidation values whereas the longer durations have low liquidation values.
Long and short liquidations are still vastly different with twelve and 24 hours being the best example.The statistics indicate a greater exposure on long traders and the losses increase with increasing time period.
The short liquidations increase much slower in longer periods in comparison with the absence of short liquidations in the shortest interval.Liquidations are distributed unequally with the long positions accounting most of the total market liquidations.