
Key Insights
- Bitwise spot LINK ETF approval triggers over 12% price increase, reflecting growing institutional adoption.
- Weekly charts show LINK consolidating near ascending support, signaling strong macro structure for bullish expansion.
- Falling wedge breakout on the 12-hour chart confirms a short-term momentum shift and supports bullish price prediction.
With the approval from the SEC for a Spot ETF, Link price prediction is gaining interest from both traders and investors, as token prices start to climb out of a period of consolidation. Traders and investors are currently identifying key support zones in the chain link token, as well as potential price targets as the price increases.
Bitwise Spot ETF Launch Supports LINK Demand
Bitwise has received formal approval to list its spot Chainlink ETF on the NYSE Arca trading under the ticker symbol CLNK. The fund is anticipated to begin trading this week and will charge 0% management fees for its first three months, where it can hold up to $500 million in assets.
As noted by Crypto Aman, “Chainlink is now officially on Wall Street! Chainlink is now institutionalized as the Oracle of Web 3.”
In addition to creating a new class of participants in the marketplace, it provides a critical factor in forming the new price prediction for LINK, which has caused LINK to increase by more than 12% over the last week, reaching from approximately $12.30 to over $13.70.
By approving this listing, it creates a new opportunity for participants in the marketplace to provide short-term momentum to the price of LINK, as well as medium-term interest from institutional participants in LINK.
Short-Term Price Movements and Immediate Targets
LINK has broken out of a falling wedge pattern, confirming bullish momentum on shorter time frames. Flash Trading has indicated that “Next stop, $16,” indicating a potential near-term rally to this price point.
LINK is currently trading around $13.80 with support at $13.60. Analysts believe that if LINK maintains this support level, it has the potential for a near-term price target of $15.80, and then $16.48, which was previously a major resistance level.
If LINK can maintain a sustained price above $16.48, this could set it up for price targets of $17.80 to $18.20; these represent the short-term LINK price prediction range in current momentum conditions.
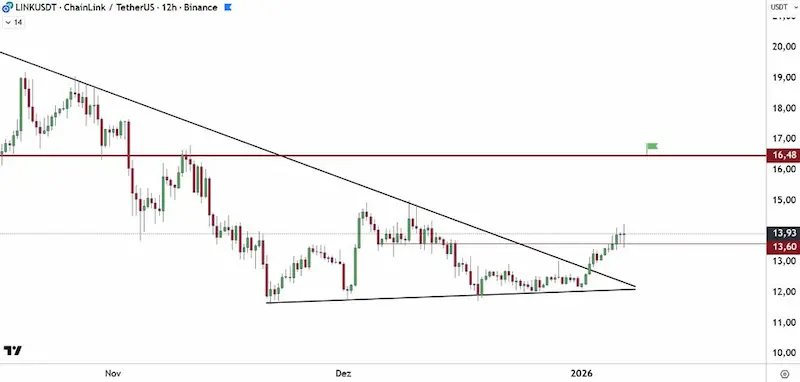 LINK breaks out of a falling wedge on 12H timeframe, targeting $16.48 resistance as bullish momentum builds.(Source: X)
Weekly Macro Structure and Medium-Term Outlook
Understanding LINK’s Movement on the Weekly Chart and its Potential for Future Growth, LINK is still trading inside a parallel upward channel, with $12.00 -$13.00 as its current lower support level.
According to Bitcoinsensus, “LINK’s price has been housed inside this large parallel channel and will likely move toward $46 in the coming months.” Historical price action of similar accumulation zones saw LINK climb to $23.00 and later to $31.00.
Therefore, if LINK continues with its trend of higher weekly lows, then the parallel channel’s upper level near $46.00 will likely be viewed as a medium-term target.
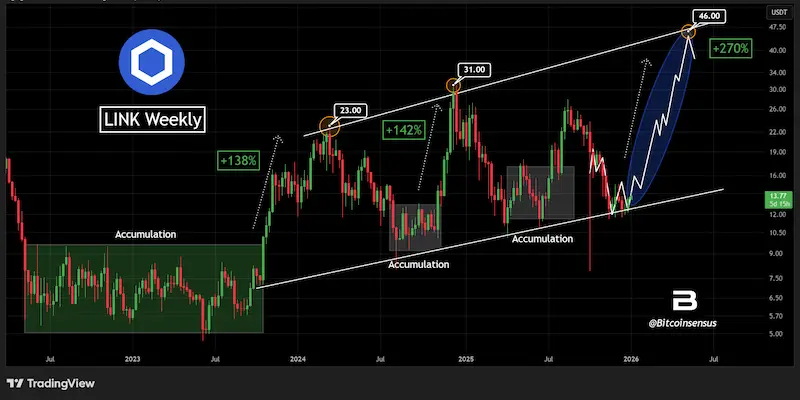 Chainlink consolidates at macro support inside a rising channel, with historical structure pointing toward a potential $46 upside target.(source;X)
Daily Chart Support and Resistance
LINK has created a support zone above the $11.87 – $13.11 range and is currently trading at $13.75 on the daily chart. There is significant resistance between $14.75 and $16.30.
If LINK closes daily above $16.30, it will confirm an ongoing bullish trend and establish a new target to the upside near $17.65. Price movements back to $13.10 are considered healthy, but if the price drops below $11.87, it would invalidate the current trend structure.
Current momentum indicators, including MACD and RSI, suggest an anticipated positive trend for Link through greater accumulation of momentum continuing to the upside.
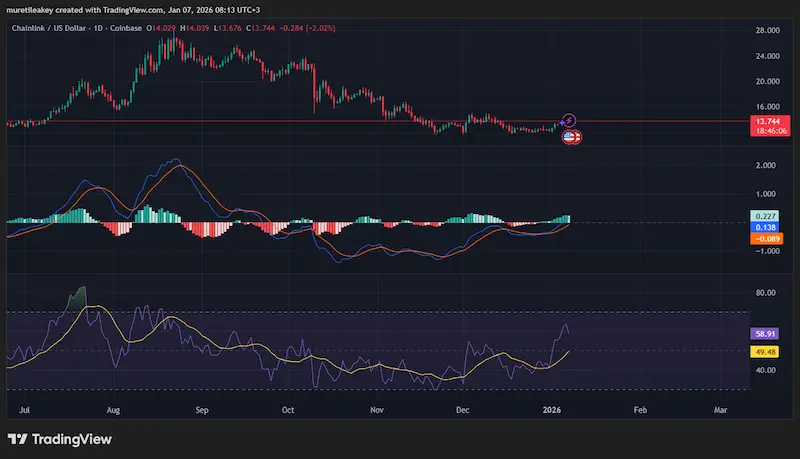 LINK forms a daily base above key support as MACD and RSI turn bullish, targeting the
$15–$16 resistance zone. (TradingView)
Key Levels to Watch
- Support Zones: $13.60 (short-term), $13.10, $11.87 (daily/weekly)
- Near-Term Resistance: $15.80, $16.48, $16.30 (daily)
- Medium-Term Targets: $17.65–$18.20, $46.00 (weekly channel upper boundary)
Trade activity continues to be influenced by the price of LINK and ETF trading volume. If the price remains at levels higher than $13.10, then LINK’s current price projection will remain positive with defined potential short-term and medium-term targets for both traders and investor but with the accompanying downside risk clearly established.