
Key Insights
- Currently, Bitcoin has stabilised at prices of around $87,000 because selling has slowed significantly, and volatility continues to decrease across sessions.
- The number of Long-Term Holders who are selling has reduced the amount of pressure being placed on the value of Bitcoin in the late period of 2025
- Testing shows that Bitcoin has failed to maintain above its main descending trend line, which indicates a directional breakout phase is nearing completion.
Bitcoin Price Prediction Faces a Critical Technical Phase
As of this writing, Bitcoin Price approaches $87 840; the Digital Currency seems to be experiencing one of its most crucial technical phases yet. Current Price Predictions for BTC are mainly on slowing down the current sell pressures, the behaviour of Long Term Holders, and breaking key trend lines that could indicate whether it will continue to trend upward.
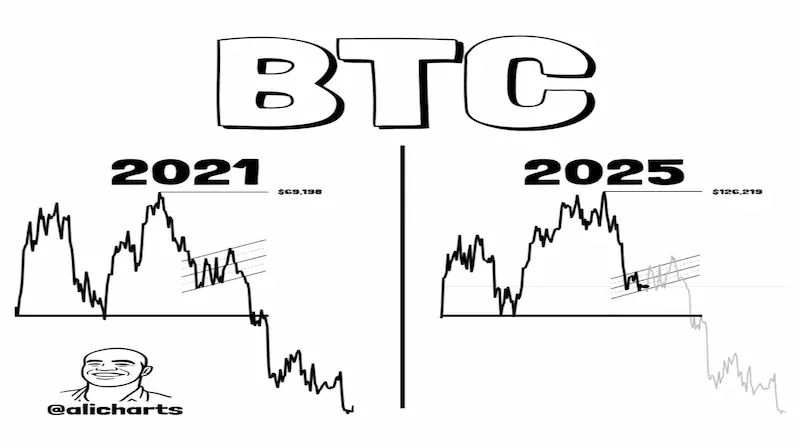
Is Bitcoin Showing the Same Topping Pattern Seen in the 2021 Cycle?
A comparison chart from Ali Charts between Bitcoin’s high in 2021 of approximately $69,198 and a high in 2025 of approximately $126,219 shows similar price action for Bitcoin between both peaks.
with a series of lower highs formed after strong price increases and the waning of bullish momentum leading up to these two peaks.
In 2021, after experiencing a strong increase in price within a rising channel, Bitcoin’s Horizontal Support was lost, and an extended bearish market followed.
In 2025, the same pattern of an upward consolidation after large declines has appeared, which is creating uncertainty for traders.
Currently, traders are debating if the next rebound in Bitcoin’s price will give confirmation as either a corrective or trend-defining rebound.
A failure to hold macro support during this current cyclical pattern may result in a repetition of the historical downward movement experienced in the past; however, historical confirmation is yet to come.
 Source:X
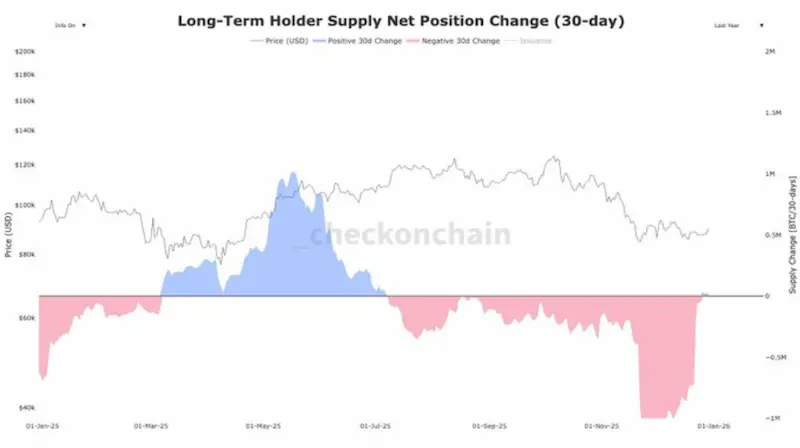
Why Have Long-Term Bitcoin Holders Stopped Selling After Months of Distribution?
According to the recent data from Bitcoinsensus, Long Term Holders (LTH) have reversed their trend of net selling for the first time since July 2023.
The 30-day Net Position Change has returned to near zero, following months of steeply negative readings in late 2025.
In early 2025, LTH’s were accumulating up to 0.8 million bitcoins, as the price moved towards the $100K range. However, this trend was reversed in mid-2025, as distribution levels increased dramatically during the market pullback, and LTH’s were at distribution levels of nearly 1 million bitcoins.
With this halt in selling, the digital asset will see less of a steady influx of supply pressure. In current price prediction models, these halts are usually followed by stabilisation phases rather than immediate trend reversals.
Source:X
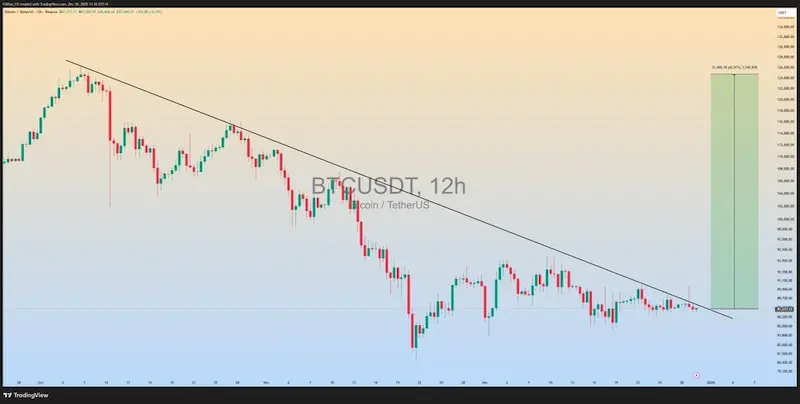
Is Bitcoin Approaching a Major Breakout From Its Long-Term Downtrend?
According to Clifton Fx, on the BTC 12h Chart, BTC has condensed beneath a major downtrend line. The current price sits between $87,000, and $88,000 with each time it retests the resistance level, it has been finding it easier to set new lows in sell volume due to low volatility, and the fact that investors are positioned to the neutral side of BTC.
BTC’s compression pattern shows low to minimal volatility and indicates neutrality with respect to the price trend.
If it can overcome the resistance level at $88,000, higher target prices are $92,000 and $100,000.
If the price is rejected at that resistance level, it will face increased downward pressure to test the $84,000 or potentially the $80,000 support levels.
 Source:X
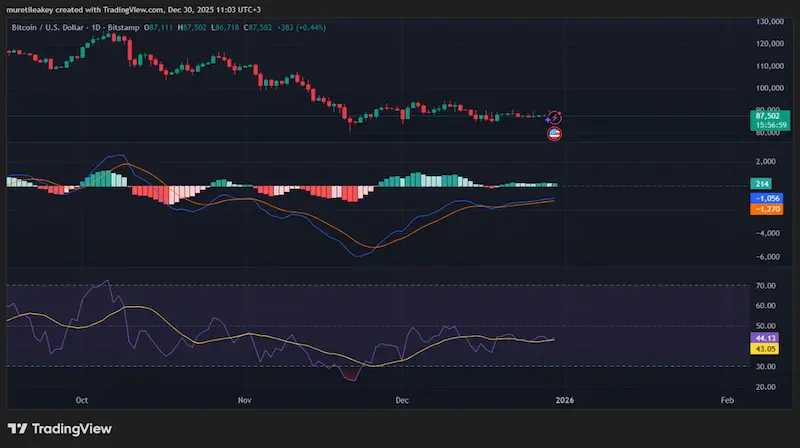
Momentum Indicators Show Stabilisation Signals
The BTC shows on the daily chart that it achieved an approximate value of $87,444, continuing its upward trend and sustaining a small amount, and above recent lows. As the day progresses, there has been no major increase in the number of candles, indicating that the urgency to sell continues to diminish.
The MACD value currently sits below 0; however, the histogram values have increased to positive territory. The RSI reverted towards 45 after reaching oversold levels earlier in the week suggests that buyers are exhausted and not aggressively selling.
These factors affect the next short-term outlook for predicting future asset value. It appears that momentum recovery supports the range trading of the asset, but there is still no confirmation of a trend until the charts break through the resistance levels.
Source: TradingView
Bitcoin Price Prediction: Possible Scenarios
If trading volume continues to increase and reach a prior high of $92,000, then it is likely to retest its last known resistance at $100,000.
If BTC were to fall below a level of $85,000, it would probably find support at $80,000, the psychological level. Due to this level previously having attracted buy-side demand, making investors’ loss constraints in that area more favourable.
In the short term, it is likely to trade within the price range of $85,000 to $92,000 until early 2026. Therefore, the current outlook for bitcoin is neutral based on BTC’s overall structure, hold behaviour and price points, but not based on any speculation.