
Key Insights
- The Dogecoin price is currently compressed beneath an established falling trendline, indicating that volatility has decreased, and market equilibrium is being maintained.
- Some evidence of a likely double bottom in the $0.121 area indicates that buyers continue to demonstrate consistent buying interest at that level.
- The immediate technical focus is the area of $0.133-0.14 for determining the near-term price trend.
Is Dogecoin Poised for a Breakout in Near-Term Doge Price Prediction?
Dogecoin continues to trade in a confined range, and the trading community is noticing several technical patterns developing around it. In recent days, the chart patterns have indicated compressing price action beneath resistance; as such, analysts are now monitoring whether any confirmation levels can be identified, which may indicate the direction of the next significant price movement.
What Is Keeping Dogecoin Below Its Long-Term Downtrend Line?
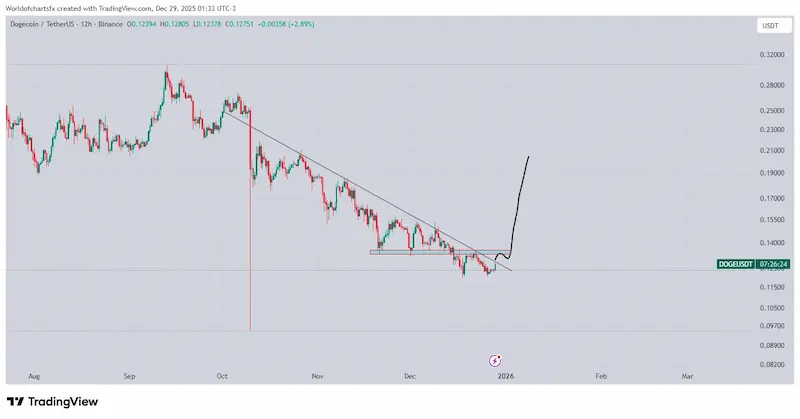
According to World of Charts, Dogecoin appears to have been moving sideways since it decisively broke through back in October, under a significant decline since it has remained below its declining trendline since that time.
The last major bounce off the bottom of the DOGE/USDT pair occurred around the peak in September, around $0.21–$0.22, which has subsequently entered a steady decline that has created multiple lower high points and continues to reinforce the downward trend line until it reached an ending point at the trend line in December.
Currently, DOGE is trading near $0.127, its long-term horizontal support level, which is situated between $0.125 and $0.128.
The area below this horizontal resistance level has been confirmed to have been an active support level and has continued to act as such through multiple tests by buyers.
Buyers have been very active within the last few weeks, and volatility has decreased as prices are rapidly closing in on the previous trend line resistance; therefore, many traders are discussing the possibility of breaking the previous trend line as a major part of their short-term DOGE price projections.
 Source:X
Breakout Levels and Downside Risk Zones
The immediate resistance range, as shown on the same chart, is between $0.135 and $0.14. If the price remains above this area, there would be a change in market structure over that timeframe.
World of Charts predicts the price to be $0.21 if there is a clean breakout. This target corresponds to where the price last saw accumulation and would be an upward move rather than the completion of that accumulation phase.
Conversely, if the price drops below $0.125, it could potentially drop down to $0.115; furthermore, should more selling pressure increase significantly, there is a probability that the price will retrace down to $0.105.
The price is currently trapped within a range until proven otherwise, thus keeping doge price predictions based upon reaction prices rather than directional certainty for now.
Double Bottom Pattern Draws Attention
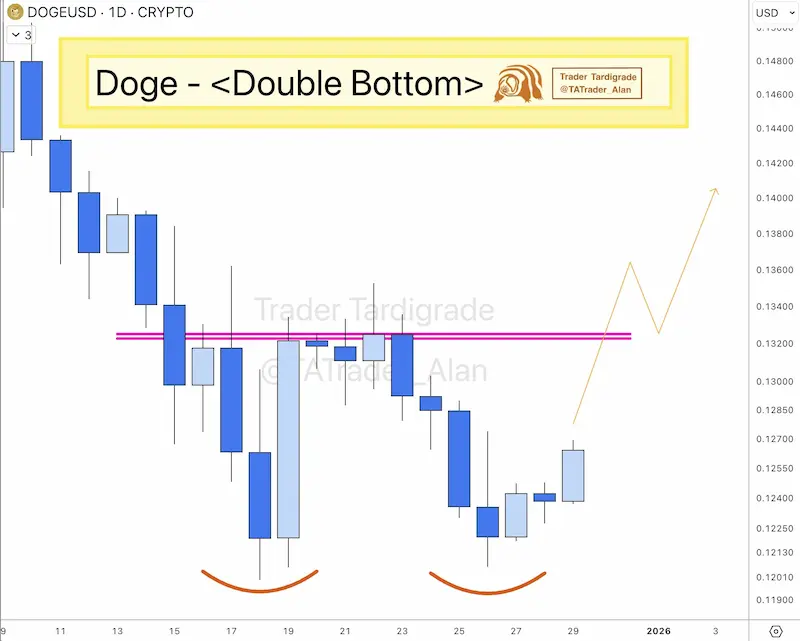
According to reports from a well-known analyst, Trader Tardigrade, the daily DOGEUSD chart shows that a possible double bottom pattern has been developing. This occurred around the price levels of $0.120 and $0.121, where two separate instances of support were established by buyers.
The second lowest support level produced a slightly higher response than the first lowest support level, indicating that there was less downward pressure on DOGE, compared to the first lowest support level.
Additionally, the price action pattern at both lows appears to have been consistent with typical accumulation, rather than possible panic selling.
The ‘neckline’ of this pattern is approximately $0.132 to $0.133, which has been rejected several times previously, confirming the technical significance of these price levels to validate this potential setup.
If there is a close at or above the neckline on a daily timeframe, this would confirm the pattern, and, therefore, the outlook for the price of DOGE over the short-term would shift from bearish recovery scenarios into bullish recovery scenarios.
SOURCE:X
How Are Momentum Indicators Shaping Price Outlook?
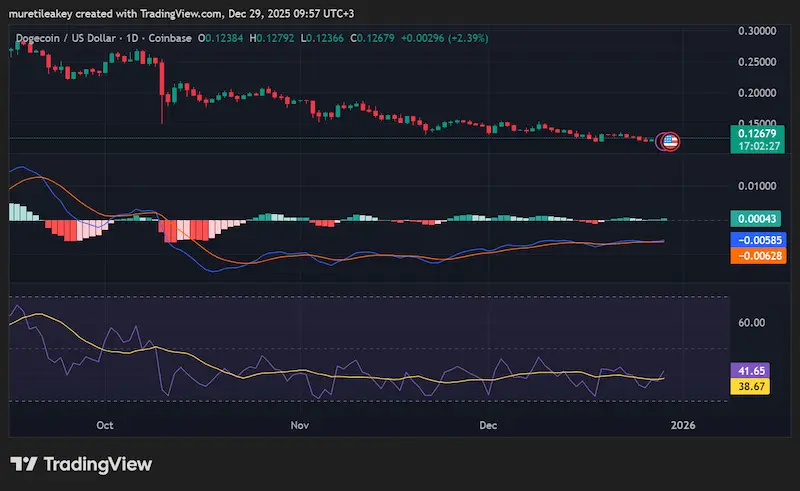
As of today, DOGE is trading at approximately $0.127 following a recent slight increase in value during today’s trading. While the price has recently bounced back up, it has remained in a downward trend since being near $0.26.
MACD Indicators are still below the Zero Line; however, the Histogram has shown a positive change, indicating that the Bearish pressure is dissipating rather than reversing.
 SOURCE: TradingView
RSI shows benefits from movement away from the lower end of its range; however, the RSI has also not yet crossed above its Moving Average. This means stabilization is taking place rather than Strength.
Additionally, most analysts agree that DOGE will continue to consolidate in a range from roughly $0.12 – $0.14 before a close above $0.14 is necessary to invalidate the current Dogecoin price outlook.