Key Insights:
- TOTAL3 market capitalization surged past the $830B mark, indicating higher demand in the larger alternative coins market.
- The dominance of altcoins maintained long-term support around 6.7%, consistent with past cycle through formations.
- Recovery in the “Fear and Greed Index” indicates that the selling pressure is weakening, while the accumulation process is gradually starting again.
Altcoins Price Prediction Improves as TOTAL3 Breaks Range
As the capitalisation stabilised and the dominance defended macro support, the Altcoin markets appear to be showing signs of early recovery. With most indicators pointing to this changing condition. Analysts who monitor the Rotation Pattern and the Long-Term Prediction Models for Altcoins have begun to pay closer attention to this space.
TOTAL3 Market Cap Shows Structural Shift
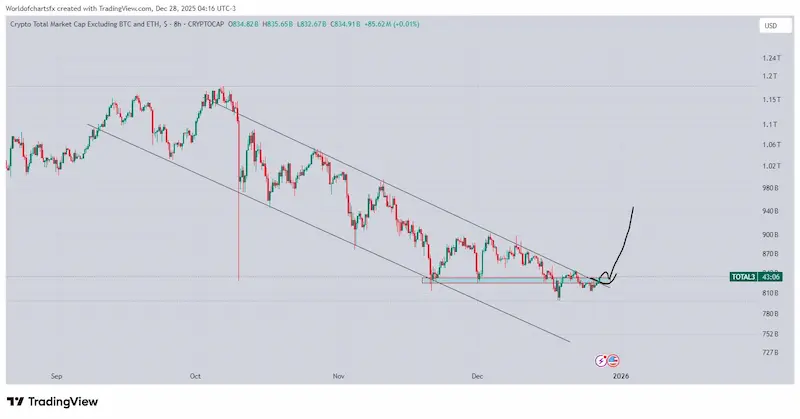
The TOTAL3 chart, a chart provided by World Of Charts, tracks the total market cap of all cryptocurrencies except Bitcoin and Ethereum, which has recently been trading in the range of $835 billion on the 8-hour timeframe after several weeks of consolidation following a large downtrend from October’s highs.
Throughout December, there have been multiple tests of support in the $810 billion to $830 billion range, with strong buying pressure coming in at each test of that area.
At present, the price is above that base range, indicating that this market is starting to stabilise and is not experiencing any further liquidation.
The descending channel that has been in place since October has been broken, with this break occurring after a number of unsuccessful breakdown attempts.
The formation of a higher low at or around the $820 billion price level further adds to the argument that selling pressure is slowing down.
Immediate resistance is found between $870 billion and $880 billion, and beyond that zone, there is a concentration of supply at the $900 billion to $940 billion level.
These levels are also being monitored by analysts within the context of their larger predictive framework for altcoin price prediction.
 Source X
Altcoin Dominance Holds Macro Support
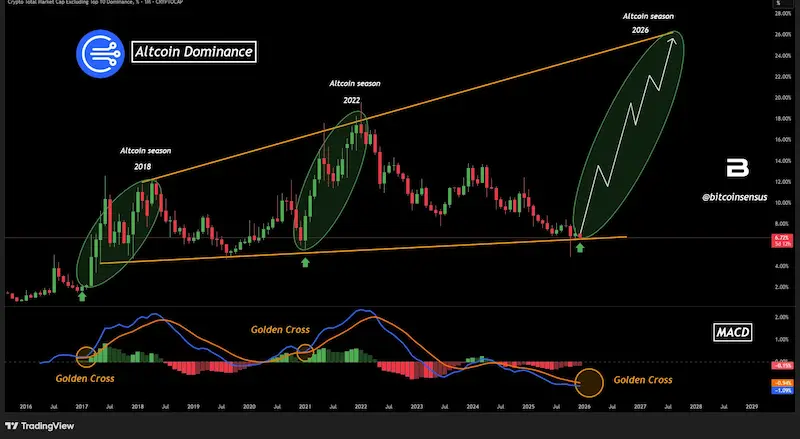
According to Bitconsensus’s recent analysis of long-term altcoin dominance, monthly. It is currently about 6.7%, which is near the historical low point for Altcoins before previous cycles of Altcoin Expansion.
Since 2016, the Altcoin dominance has remained within an upward-trending Macro Channel. Before each of these Recovery Periods, the Price was tested at the Upward Trend Line.
This current structure is similar to the previous structures. Dominance appears to be Stable, whereas Dominance did not collapse further during those periods.
There appears to be a monthly MACD A Bullish Crossover forming near the Historical low points. There have been Similar Setups to this leading into the 2018-2022 Alt waves. The Momentum continues, although the downside pressure seems to have maxed out.
It is estimated that the price will reach the 12% to 15% range, and that range typically coincides with increased participation in the overall Market and an Increase in Interest in Alt Price Prediction Analysis.
 Source X
Fear and Greed Index Signals Cautious Accumulation
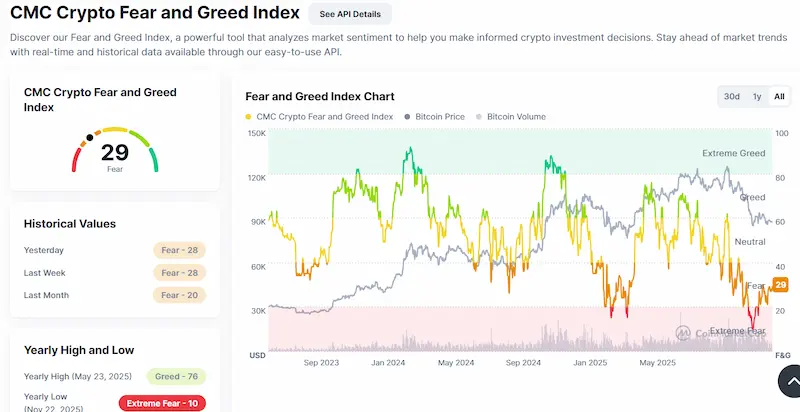
The crypto fear/greed index indicates that market mentality is still quite low and continuing to drop; as of right now, it has an indicated value of 29, which places it squarely in the fear zone. Previously, it experienced a recovery from the bottom of a previous selling wave when it reached its lowest point around 10 in November.
On average, we see highs and lows of fear receding in time and in volume over recent weeks. Many of the increases in volume during these periods of fear tend to be due to emotional and, over time, an absence of activity within the marketplace.
Providing little time to establish trends that reflect continued volatility within the ranges established by prior high-volume sales. This correlates directly with a bottoming-out process.
Since many price movements happen before they’re reflected in indicators, most analysts look to confirm altcoin price predictions via provide indicators for volume-related and dominant (percentage allocation) changes.
Source: coinmarketcap
Combined Signals Shape Forward Market Outlook
The combined view of capitalization, dominance, and sentiment suggests that the current phase of the market is a transitional phase. The fact that TOTAL3 remains above this key support level provides further confirmation of this transition phase in relation to capital rotation.
The relative stability of dominance offers additional support for this concept of continuing capital rotation.
The structure of charts during transitional market phases usually exhibits accumulation behaviour as opposed to distribution behaviour. Traders are evaluating each of the resistance levels with a view to whether they will convert into support levels.
The analysts with Bitcoinsensus observe that historical relationships amongst dominance cycles have been consistent. As with the current market, previous expansions during dominance cycles exhibited very similar technical characteristics.
Technically speaking, the current market structure is very closely aligned with the structure seen during previous expansions.
While still very much uncertainty exists, data-driven participants will continue to refine their price prediction models for altcoins. They remain focused on support levels, resistance levels, and sentiment across the marketplace.