Key Insights
- Glassnode heatmap data has identified a strong resistance at $2.17 and a firm support at $1.78–$1.96, indicating that major investor positions are shaping XRP market behavior.
- Whales have dominantly accumulated near $2 reflecting increased institutional activity and deep liquidity in the market.
- XRP’s integration with Solana via wXRP will expand its DeFi liquidity, and align it with historical accumulation zones and strong long-term support levels.
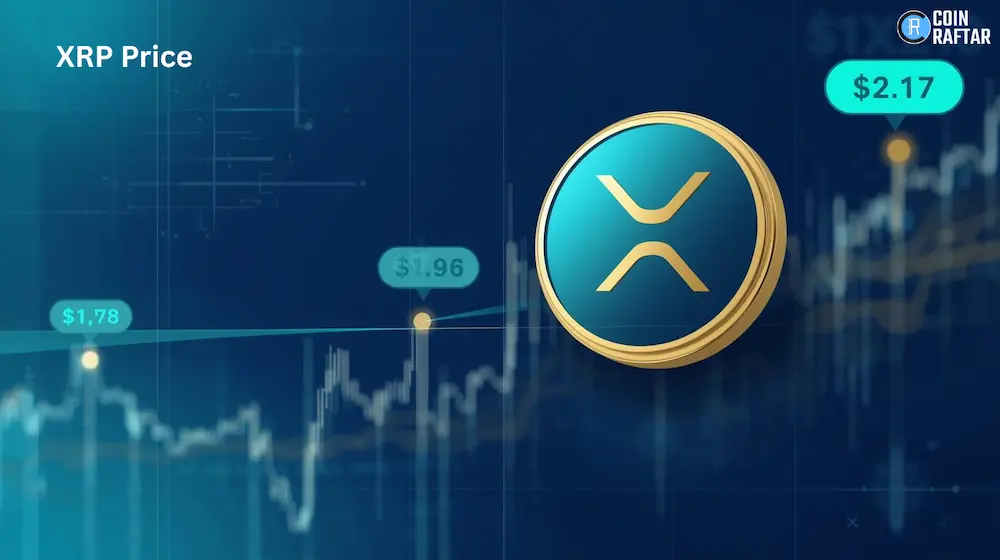
XRP trades at $2.04 with a 24-hour volume of $2.85 billion. The price rose 0.89% in the past 24 hours but declined 1.42% over the week. Glassnode data identifies $2.17 resistance and $1.78–$1.96 support levels. There is strong investor accumulation and whale-driven orders that are shaping XRP’s short-term momentum.
Understanding XRP’s Strong Support Floors
Glassnode’s XRP Cost Basis Distribution Heatmap shows key support and resistance levels. It highlights price points where long-term holders tend to defend positions. Warmer colors indicate heavy accumulation, while cooler colors show lighter ownership.
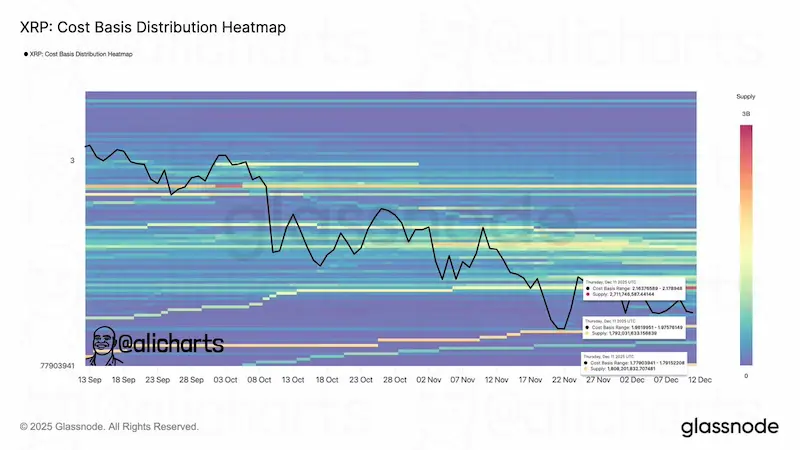
XRP Cost Basis Distribution Heatmap / Source : X
XRP repeatedly tested deeper cost-basis layers between mid-September and mid-December. Bright accumulation bands have been mapped around $0.50–$0.55 and $0.60–$0.65 has been highlighted as the structural support zones.
Whenever price approaches these levels, significant buying pressure occurs and stabilises the market limiting further declines. In early December, XRP dipped into accumulation regions near $1.09, $1.23, and $1.77.
Historically, these clusters have shown notable buying activity that has pushed far above current price. This move suggests that holders are sitting on so much unrealized losses. Often, such positioning may dampen selling momentum and end up creating resistance during upward price moves.
$2.17 Resistance Holds Market Attention
As noted by Glass node, $2.17 represents a key resistance level that bulls need to break convincingly in order to push towards previous all time high. Recently, the asset experienced moderate gains, which saw it climb from below $1.99 to above $2.05.
The price has maintained a narrow range between $2.02 and $2.05 forming a consolidation phase that reflects steady trading activity without excessive speculation. Additionally analysts further on compared the current structure to a 2017 bullish phase structure.
The current structure shows the asset testing long-term structural patterns similar to December 2017. The 2017 period started by revisiting the 21-month EMA preceded by strong rallies as the asset remained above the multi-year trendline.
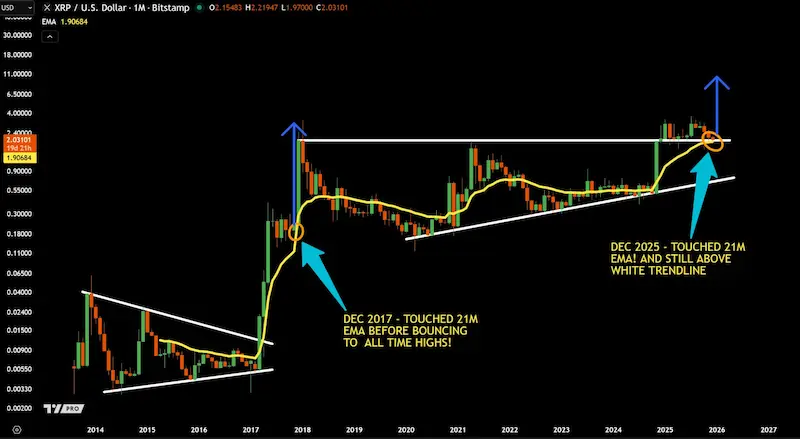 XRPUSDT Price Chart / Source: X
This move is suggesting that the market could consolidate near resistance for a moment before attempting any breakout. The sustained pressure below $2.17 indicates that investors are cautiously balancing their potential gains with historical resistance.
Therefore, if buyers overcome this zone, XRP could see increased momentum and follow the patterns of past cycles that could open doors to revisit all time highs.
XRP Whale Moves Point to Accumulation Phase
Recent data shows that whales are actively trading XRP even as its prices fall. Market watcher CW8900 noted that large orders have now dominated the market. This surge is a reflection of focused accumulation.
The accompanying Spot Average Order Size chart shows green and light-green dots near the $2 range, despite low retail participation volume. This continued whale clustering suggests the presence of a stronger liquidity in a maturing market structure.
Institutional activity has continued increasing notably and this has helped to stabilize price movements. XRP will soon integrate with Solana via Hex Trust and Layer Zero to bring liquidity via XRP.