Key Insights:
- Zcash is still sliding toward the major liquidity zone near $300, with strong selling pressure pushing the price lower and keeping the downtrend in place.
- Funding rates remain negative, showing that traders are leaning heavily on short positions even as the market sits in oversold conditions.
- Zcash transaction activity surged to rare peaks in November revealing volatile network behaviour ahead of the asset’s broader decline.
Zcash (ZEC) trades at $318.49 after a sharp 12.14% daily drop. The coin has lost 37.73% this week as sellers keep pressing lower levels. Liquidity clusters near $300 continue to attract price action. Market sentiment remains strained as funding stays negative and volatility rises.
ZEC is Tracking Toward Heavy Lower-Level Bands
ZEC is sliding gradually towards a predictable path along its liquidity map. Analysts have identified dense liquidation clusters forming between $297 and $311. Analyst ArdiNSC termed it as “grinding straight into that thick yellow liquidation band,”. This is due to the sellers continuing to overwhelm the market.
Observations on the structure indicates that ZEC has repeatedly returned to liquidity pockets. Additionally, it has behaved in line with algorithmic order-seeking behavior. Throughout November, the liquidity heatmap revealed a broad topping structure, followed by a sequence of lower highs.
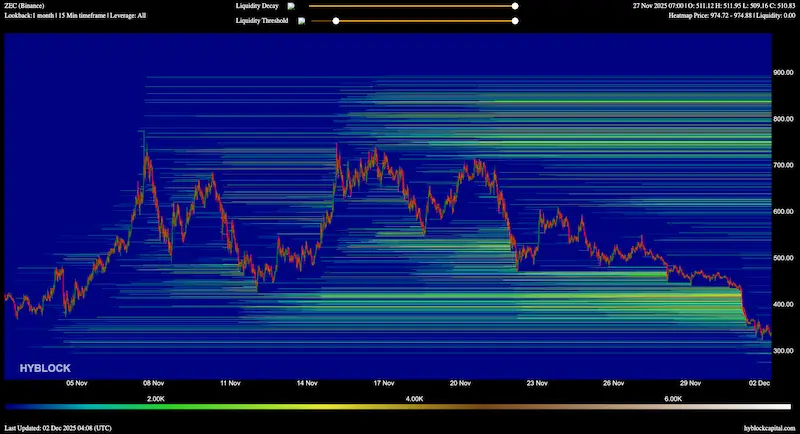 Cash ZEC Liquation Heat Map / Source : X
This is as price interacted with major liquidity concentrations near $700, $600, and later $500. This move suggested that each step down cleared resting orders before continuing lower. The recent drop toward the $300 zone formed a vacuum above and a heavier liquidity wall emerged below.
The heatmap’s distribution suggests sustained liquidity-targeting flows, with ZEC tapping cluster after cluster as the downtrend progressed. Each lower band has acted as a magnet, guiding the market into deeper areas of demand.
Accelerated Breakdown Pushes Price Toward the $300 Target Zone
ZEC’s 4-hour chart shows a decisive trend break, as the asset moved beneath its descending structure with strong momentum. According to Ardi, the market remains heavy, and sellers “are still suffocating the market,” .Momentum indicator the RSI prints deeply oversold readings near 18.
Despite this, price has shown limited reaction, suggesting that the downtrend remains intact.
The latest move sliced through several support areas. As at press time price trades just above the green target zone around $300–$290. This point aligns with the 61.8% Fibonacci level near $288.
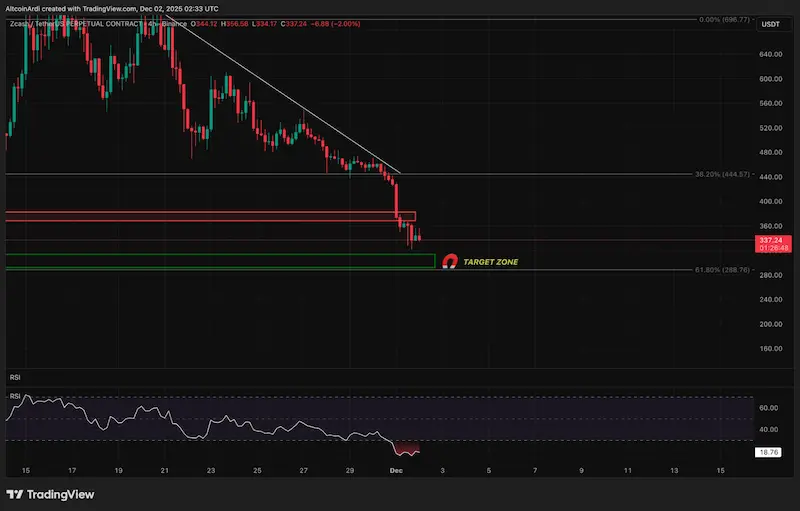 Zcash ZEC Price Chart / Source: X
This confluence creates an area where temporary stabilisation could emerge. Until ZEC reclaims the $360–$380 ,the broader structure remains in the bearish region. According to CoinGecko data ZEC is currently the largest weekly loser among major privacy assets.
The asset fell 33% this week and 19% in the past 24 hours. Furthermore, the asset is down more than 50% from its November peak.
Funding Data and Transaction Trends Reflect Ongoing Market Stress
ZEC’s funding-rate heatmap shows persistent stretches of deep negative APR, with darker purple bands indicating aggressive short-side dominance. Traders have continued are preffering elevated rates to maintain short exposure. This trend is mirroring the strong downward pressure in spot pricing.
These extended negative readings often occur near moments of high volatility. Transaction activity also reflects unusual behaviour during this period. In early October, Zcash activity was steady, with normal transaction levels.
By mid-October, daily transactions climbed toward 12,000. The jump continued in November, reaching almost 75,000, then spiking again above 65,000. After these surges, activity dropped below 10,000, showing a short, concentrated burst.
Compared with Monero, ZEC’s transaction activity swings more sharply, reflecting quick shifts in usage. Bulls must reclaim key support levels with strong volume before any clear trend change can form.