
Key Insights:
- XRP is showing repeating cycle behavior near macro resistance levels as established demand zones continue shaping the ongoing consolidation across the broader market.
- Chart comparisons are showing XRP forming four swing points which resemble past patterns and are showing measured accumulation within a wider liquid trading environment.
- Massive ETF inflows and steady premiums across major products have contributed to stable liquidity as short-term indicators cool in a yet orderly consolidation phase.
XRP’s market is drawing attention as chart structure shows similar patterns from the past repeating current cycles.Analysts are watching key resistance levels, accumulation zones, and ETF activity as the asset moves through a quiet but steady period of consolidation.
Macro Resistance Zones Mirror Earlier Cycle Behavior
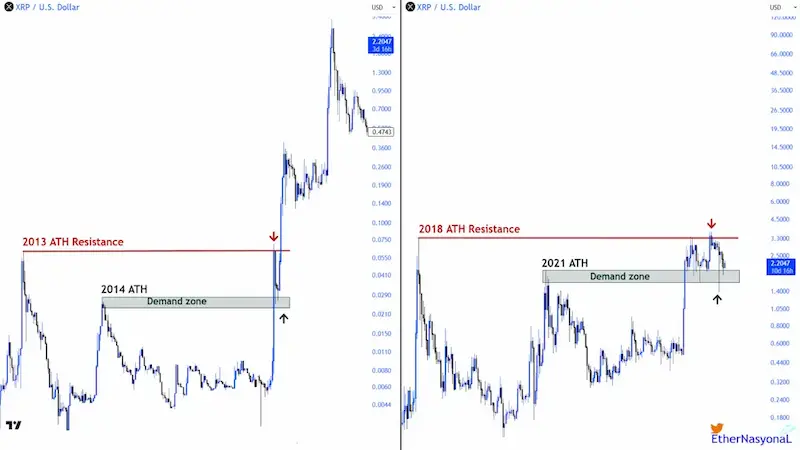
Technical analysis prepared by analyst EtherNasyonaL shows XRP’s long-term charts.The analyst pointed out that two major market cycles share a similar structure. In the earlier cycle, the 2013 all-time high acted as a strong ceiling, causing multiple rejections before price finally broke above it.
Below that level, the 2014 high created a wide demand zone where buying slowly picked up.The analyst said XRP seems to be moving in a similar way now but on a larger scale.
The 2018 high is acting as the main resistance, while the 2021 high has become a demand area where the market continues to absorb selling pressure. Price has tested this area several times, showing steady interest from traders.
Source:EtherNasyoNal
At the moment, XRP is trading between these two key levels. The current consolidation zone is wider than in past cycles, which reflects a bigger market with more liquidity. Because of this, any major move upward may take longer to form.
Historical Swing Patterns Compared With Current Structure
Another analyst compared the 2017 structure to a projected pattern for 2025. The earlier chart formed four swing points during a rounded base before price acceleration.
Each point reflected a period of tighter trading conditions and reduced liquidity.The projected 2025 structure formation has gone through four similar points.
With each step showing sell-offs followed by gradual recoveries. The symmetry between the two charts suggests the market remains in a measured accumulation phase.
https://x.com/Steph_iscrypto/status/1994048565199405338?s=20
The shapes appear similar however the current structure is broader and has formed at higher price levels.The asset is now trading near the fourth point. In the past this point marked the final dip before stronger movement in the previous cycle.
Short-Term Conditions and ETF Data Shape Market Context
XRP is moving into a slower consolidation phase in the shorter time frame. On the XRP/USDT 30-minute chart it has formed flattening highs and minor lower lows.
Trading volume has cooled, an indication of reduced participation during the range-bound phase.Momentum indicators are also cooling. The MACD is now moving around the zero mark after the bullish wave faded.
The RSI sits near 42 staying above deeper oversold conditions showing slight pressure from sellers.The indicators are showing that the market is yet to be fully dominated by buyers.
ETF-related data from RipBullWinkle shows a report that $622 million in inflows were recorded in over 13 days. The first seven-day ETF volume was nearly $495 million.There was tight spreads and mild premiums across Bitwise, Franklin and Canary products.
This shows that steady demand remains as XRP trades around $2.23.The broader Crypto market is in a recovery mood and XRP could ride the wave.
Major coins like Bitcoin have registered a slight intraday and the whole week improvement.The total market cap is up by almost three percent in the last twenty four hours.