Key Insights
- The short-term SUI price forecast indicates a recovery from a dip in the price of SUI caused by token unlocks at the beginning of January.
- SUI price has broken through the key $1.47 support level and could potentially continue toward the $1.50 resistance level.
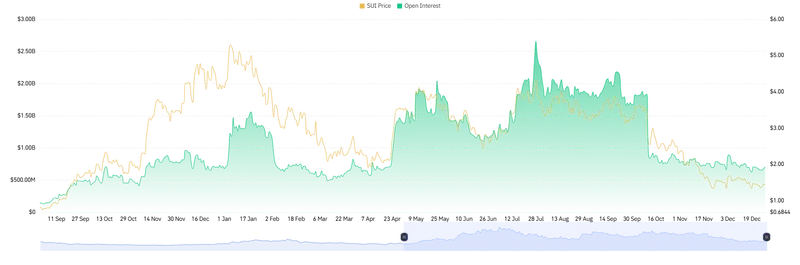
- SUI price momentum is supported by both futures and open interest data, showing strong demand from speculation-driven players.
The short-term recovery in the Sui Network (SUI) results from the unlocking of 55.31 million tokens on January 1, 2023. The $78.9 million in unlocked capital positions SUI close to important resistance levels at $1.50, with support levels forming around $1.47, which should influence future price movements for SUI over the next few days.
SUI Price Prediction Shows Short-Term Recovery
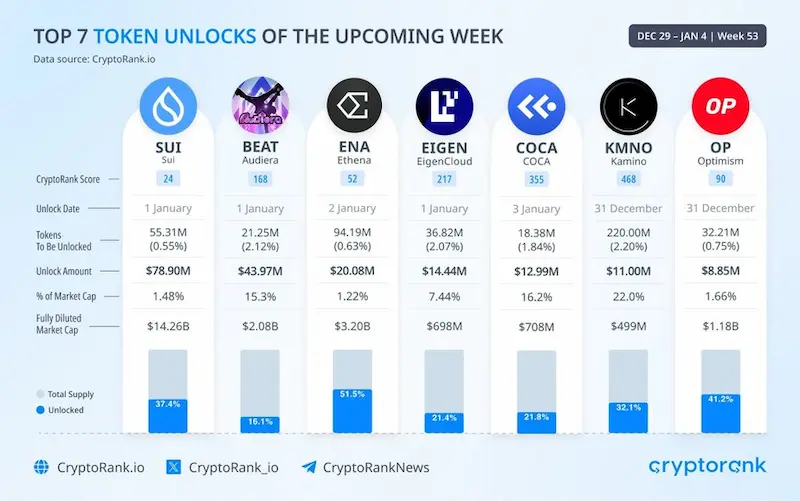
The SUI token has been experiencing an uptick in its price since a large amount of 55.31 million of its tokens will be released into circulation as of January 1st, which equals approximately 0.55% of the Total Supply.
As stated by Crypto News Hunters, SUI is responsible for more than 41% of the total capital that was released into circulation this week, which could lead to significant price movement in the near future because of the amount of liquidity it has created.
 Source: X
What Are the Key Levels for SUI Price Prediction?
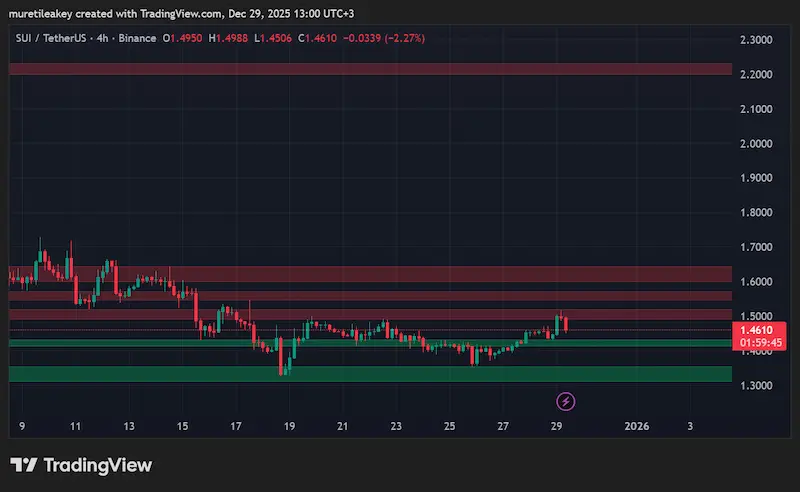
The SUI price prediction has determined a resistance level between $1.50 to $1.52 that includes the most recent swing high. A break above that area should result in price action moving toward the upside target of $1.58 to $1.60.
There is immediate support at $1.45 and an overall heavier demand area from $1.38 to $1.40. If the SUI price failed to break the resistance level of $1.50, there’s a strong possibility for short-term consolidation at $1.47 and the bullish recovery structures remaining intact.
The 4-Hour price action has formed a series of higher lows since December 26, indicating a definite increase in price movement. The momentum at the time the price is finding resistance is beginning to settle down from the highs, but remains higher than the immediate support at $1.45.
 Source: TradingView
How Do Technical Indicators Reflect SUI Momentum?
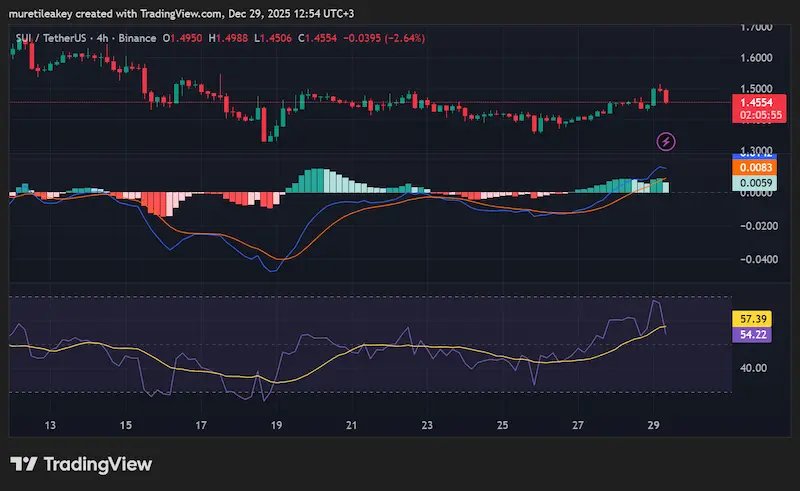
The MACD indicates bullish activity as seen with the formation of a bullish crossover and the increase in the histogram, suggesting there are bullish momentum trends developing.
There are signs the histogram may be flattening, which suggests the last bullish move could be slowing down as price approaches resistance levels.
Currently, the RSI is 62.44 compared to a 57.98 moving average. This confirms the momentum is still sustained with additional room for bullish movement without being in an overbought condition; therefore price should continue to grow if there continues to be buying pressure.
The above indicators confirm strong momentum to continue upward through short-term periods. However, there should be caution as the price appears to be near resistance at $1.50.
 Source: TradingView
What Does Futures and Volume Data Reveal About SUI?
SUI has seen a strong bounce back intraday from between $1.43-$1.44, with price closing above both VWAP and the session midpoint.
The volume for futures was $1.02 billion and is significantly higher than the spot volume of $132.61 million, demonstrating that traders are utilizing leverage to take advantage of SUI’s price moves.
Open interest is still very elevated at $718.25 million, indicating that traders are actively taking positions on SUI, and the active speculative interest in SUI continues to grow.
However, as open interest has gradually decreased in the past few days, the volatility caused by leveraged traders should start to calm down, leading to a return to a more stable price for SUI.
This divergence between futures and spot volume on SUI indicates that SUI regaining its value has been predominantly based on traders taking on more risk with leverage rather than a reflection of actual market demand for SUI.
 source: Coinglass
What Are the Possible Scenarios for SUI Price Prediction?
If the SUI remains above the range of $1.47 to $1.48, the price may break above $1.51 and continue in a bullish style, so keep an eye on volume for confirmation to determine if prices will keep moving higher.
If SUI does not break through the $1.50 resistance area, it may have to retest $1.45 or pull back further towards $1.43; this would still create the basis for a healthy recovery, where consolidation will likely take place before any future rally attempts.
The short-term trend of SUI shows solid support from increased volumes, and the market has formed higher sum levels, therefore showing that there is buying strength, with recent liquidation of short positions also strengthening the current bullish trend.
Traders will want to be aware of the level of $1.50 as resistance and $1.47 as support for a clearer direction for future price fluctuations.