Key Insights
- Solana has tested the $100–$130 demand zone, this indicates it as a structural accumulation support zone which may spark a significant relief rally into 2026.
- High leverage positions at the launchpad highlight ongoing market stress,therefore reclaiming $130–$135 could trigger short-covering and accelerate upward movement.
- Price consolidation and higher lows are a reflection of price stability caused by the cautious accumulation in preparation for a potential market rebound in coming months.
Solana is retesting its $100–$130 launchpad support. The resultant structure is signalling a potential turning point for the asset in 2026. On the weekly charts,price is compressing and sellers are losing momentum.
Historical demand zones suggest that this is an accumulation, not panic selling; this is as shorts and leverage weigh on traders. Therefore, if SOL holds, it could start a recovery toward $150–$160. If this materialises it could trigger broader market confidence, and position it as a key crypto bellwether.
Solana Launchpad Zone Gains Strength After Market Cycle
On the weekly chart, SOL has retraced to the $100–$130 demand region. This is a key zone that previously was a base for major price expansions. This revisit occurs after a full cycle of distribution, mark-up, and correction, that is providing context for potential long-term direction.
Sellers appear exhausted, as downward candles compress, an indication of limited momentum. Notably, a weekly close above this zone may favour accumulation, and offer a foundation for future gains.
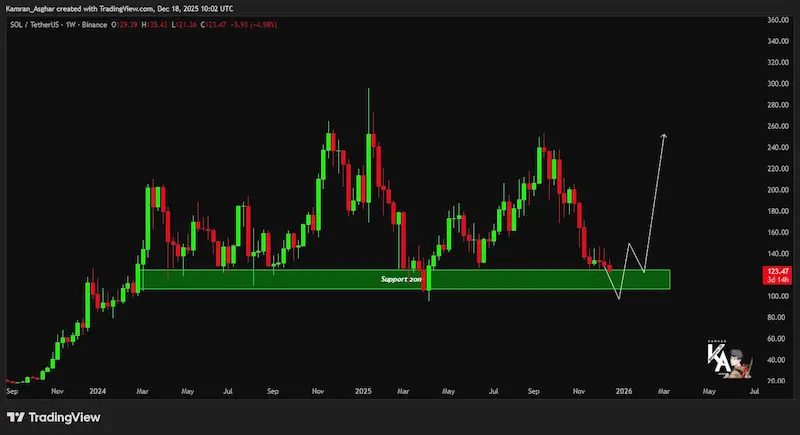 SOLUSDT Price Chart | Source: X
The historical levels around $100–$130 are aligned in a range of lows, consolidation shelves, and high-volume acceptance. This shows that it is a firm structural support and this reinforces it as a potential launchpad for upcoming bullish movements.
Short-Term SOL Price Pressure and Leverage Risks
Zooming into the 4-hour chart, SOL displayed controlled downtrend behavior. The asset printed a series of lower highs but remained consolidated near $122–$123. Over time this support has absorbed repeated selling pressure.
Additionally, a whale has opened a long position of $30.9 million with 20x leverage. The whale trader currently sits at a ~22% drawdown located within the launchpad zone. This concentration points to current market stress and potential near-term liquidity pressure.
Upside resistance remains tough at $130–$135. Analysts have noted that a decisive hold above this range could trigger a short and rapid move toward $145–$150. Conversely, failure below $120 risks a sweep toward $95 or even $85–$90.
Accumulation Signals Point to Stabilization in SOL
Intraday trade price action followed a sharp drop near $133–134 before a stabilization between $122 and $124. This reflects a market round equilibrium rather than panic. Volume levels also suggest that there is a measured accumulation by buyers.
In addition, the gradual upward movement toward $125–126 indicates that confidence is rebuilding, this has been further confirmed by higher lows forming. This slow recovery points to an accumulation period.
Therefore, SOL’s reaction within the $100–$130 launchpad will determine market direction. If bulls reclaim the $130–$135 zone successfully they could ignite a broader relief rally. Consequently failure to hold may trigger a final liquidity reset.
This structural zone represents a risk-defined entry for traders monitoring Solana for long-term accumulation opportunities. Traders need to patiently watch for trend reversal signals around these critical support levels.