
Key Insights
- Solana price movement follows a long-term rising trendline that has supported several notable rebounds since 2023.
- Solana’s short-term Elliott Wave analysis has identified support at $133–$137 and possible extension targets at $146 and higher.
- Intraday, Solana surged from $126.77 to near $140 supported by rising futures volume, open interest, and stable funding rates.
Solana price marked a 9.99% gain in 24 hours, a move that was pushed by strong intraday buyers momentum. This saw the asset surge to $140.40 and trading volume reach $7.11 billion, which is reflecting robust market interest.
Overall, as Solana continues holding its long-term ascending trendline it is up by 0.12% over the past week. Steady support and rising futures activity indicate continued bullish control.
Long-Term Structure Shows Strong Support For Solana
In a recent post on X, market commentator Ali observed that Solana has held its long-term trendline. A reference chart shared by the analyst indicates multiple rebounds along this rising support. Furthermore, this support level has guided the asset since early 2023.
Each rebound was followed by clear upward moves. Traders viewed the trendline as a structural reference after several successful tests across 2023 and early 2024.
The 2023 rally recorded gains of more than 1,300 percent into late 2023 before entering a consolidation phase. Despite periods of volatility, the market preserved higher lows, which kept the long-term structure intact.
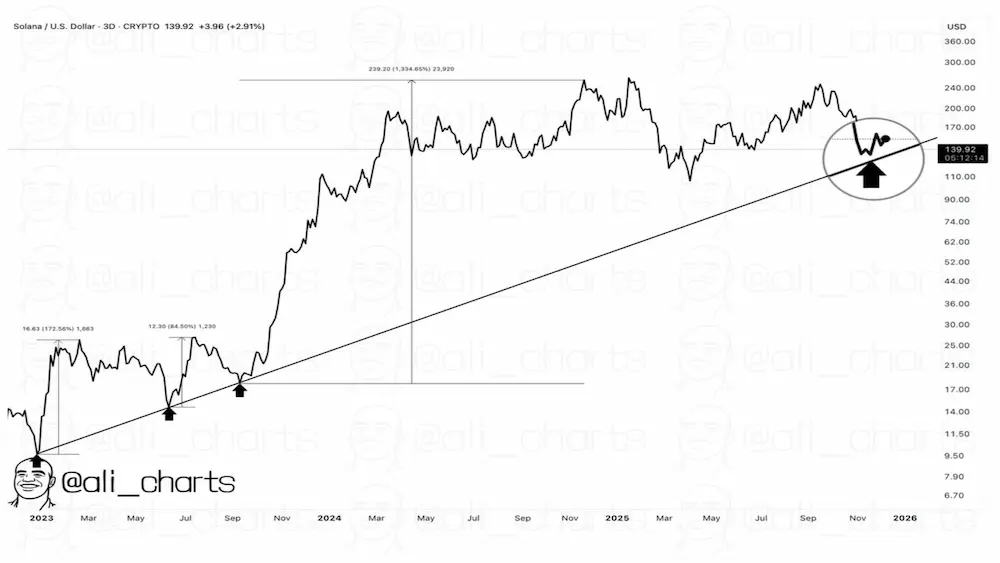 Solana 3Day Price Chart /Source: X
The most recent pullback brought the asset back toward this trendline, where it formed a small bullish structure. Furthermore, market participants have identified that earlier rebounds from similar points marked renewed upward phases.
This therefore makes the structural support remain valid as long as price stays above the rising base.
Solana’s Short-Term Wave Structure Maintains Bullish Bias
Another explanation from More Crypto Online added that Solana was testing micro support between $133 and $137. This zone could host a Wave (4) correction before a potential continuation toward $144 to $146.
However, the view remains constructive for as long as the market respects this support area.The Elliott Wave count showed a completed corrective formation before a fresh impulse began to unfold.
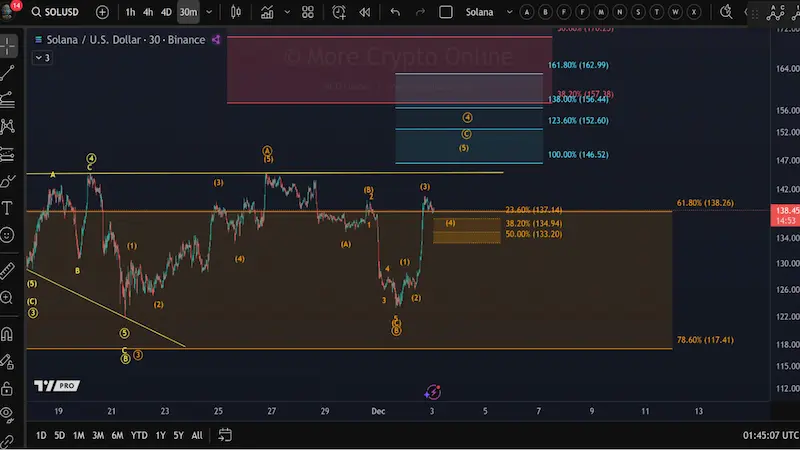 Solana 30Min Price Chart / Source: X
Wave (3) rally then extended toward the 61.8 percent retracement of the prior decline, followed by a pause. The analyst has projected extension targets from $146.5 followed by a climb to $163.
Traders tracked these levels as the next potential resistance areas if a clean Wave (5) move developed. The scenario stayed valid as long as the projected corrective region held.
Solana Intraday Momentum and Derivatives Activity Rise
Over the past 24 hours, Solana price moved sharply from $126.77 to near $140, producing a daily gain of about 10 percent. The rally formed quickly, with an aggressive surge between $128 and $138.
The move shows that there was a strong buying interest and short covering. After reaching the $140 area, the asset moved into a tight consolidation range repeatedly forming small pullbacks and a series of higher lows.
This movement kept intraday momentum steady. Concurrently ,market data accompanying the chart showed $18.45 billion in futures volume and $7.21 billion in open interest.
A wider funding-rate heatmap showed Solana maintaining mostly positive and moderate values from early November to early December. The consistent readings indicate long participation without extreme positioning.
In the meantime, the asset remains comparatively stable against more volatile markets during this period.