Key Insights
- Solana price stabilises above $120, forming higher lows that indicate short-term bullish momentum is returning.
- Recent reclaim of the 4-hour 200MA supports potential trend continuation toward $148–$150 resistance levels.
- Price consolidates below $140 while open interest remains stable, signalling controlled accumulation and structured market growth.
Solana Price Eyes Key Resistance After Extended Downtrend
The price of Solana stabilised after being in a downtrend for several months. At this writing time, the digital currency is working through both its key support and resistance areas, while also attempting to break through the 200-period moving average. There is short-term bullish momentum; however, it is very important to continue closely monitoring the resistance levels.
Recovery from Consolidation
The Solana price chart shows a period of consolidation between $120 and $140. After a significant drop from approximately $190, the chart demonstrates that $120 has functioned as an area of strong support.
As the price was tested numerous times and was held down. In the last few days, we have observed new higher lows form, indicating a potential reversal soon.
According to The Disciplined Trader’s tweet, the technical target of multi-timeframe accumulation is around $146.91, and the market has not reached that price yet.
There is no guarantee of a move to the target, but high-probability accumulation patterns are likely to develop and, if so, could offer patient traders a chance for further price appreciation.
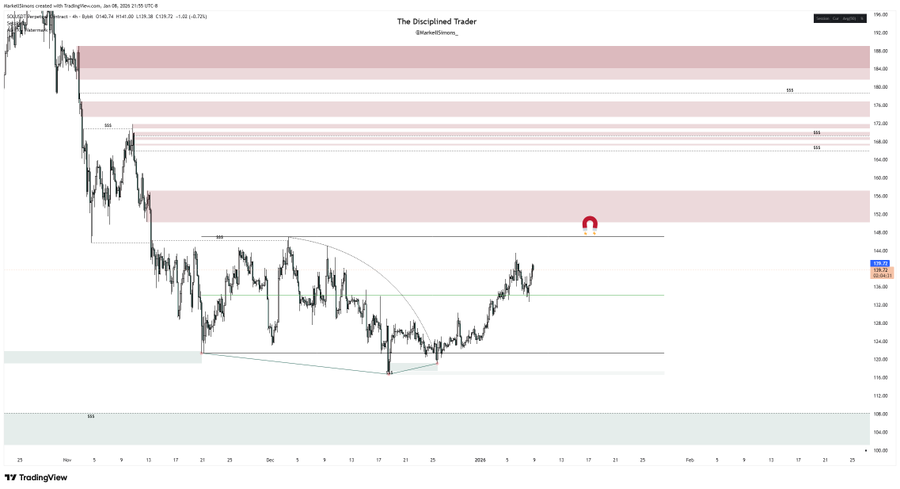
“Price rebounds from $120 support, targeting $148 resistance, signalling potential bullish reversal within long-term downtrend zones.”(source X)
Key Support and Resistance Zones
Solana seems to be currently finding support between the prices of $120 and $132, as these levels have acted as strong stopping points for any price decline thus far, and have provided buyers with an area in which they can place trades.
We have seen that $132 was once considered a level of resistance, but has now become an area of significant support for future pullbacks back into that zone.
Price was met with resistance at $148, when many traders opted to take profits at that point. From this price point, if a break above $148 occurs, we expect the price to move upward toward $152-$156.
It is likely to come up against additional long-term levels of resistance in the chronological range of $162 to $170.
How price performs in this range will be a good indication of whether bulls will be able to continue to have control over Solana in the near term.
Indicators and Moving Averages
Inmortal Crypto recaps that it is the first reclaim of the 4h-200-period moving average after 85 days. In addition, the Solana price crossed over this MA (approx $140), signalling early bullish action.
If the MA is back tested successfully, then this may confirm momentum towards resistance levels above $150.
Despite slight pullbacks, indicators such as RSI at ~55.91 are still above neutral, suggesting the continuation of bullish momentum.
On the 4-hour MACD, we see a slight bearish crossover, which indicates that there has been some consolidation as opposed to a reversal in trend.
Thus, there is reason to believe that Solana’s price may consolidate before attempting to establish an upside movement.
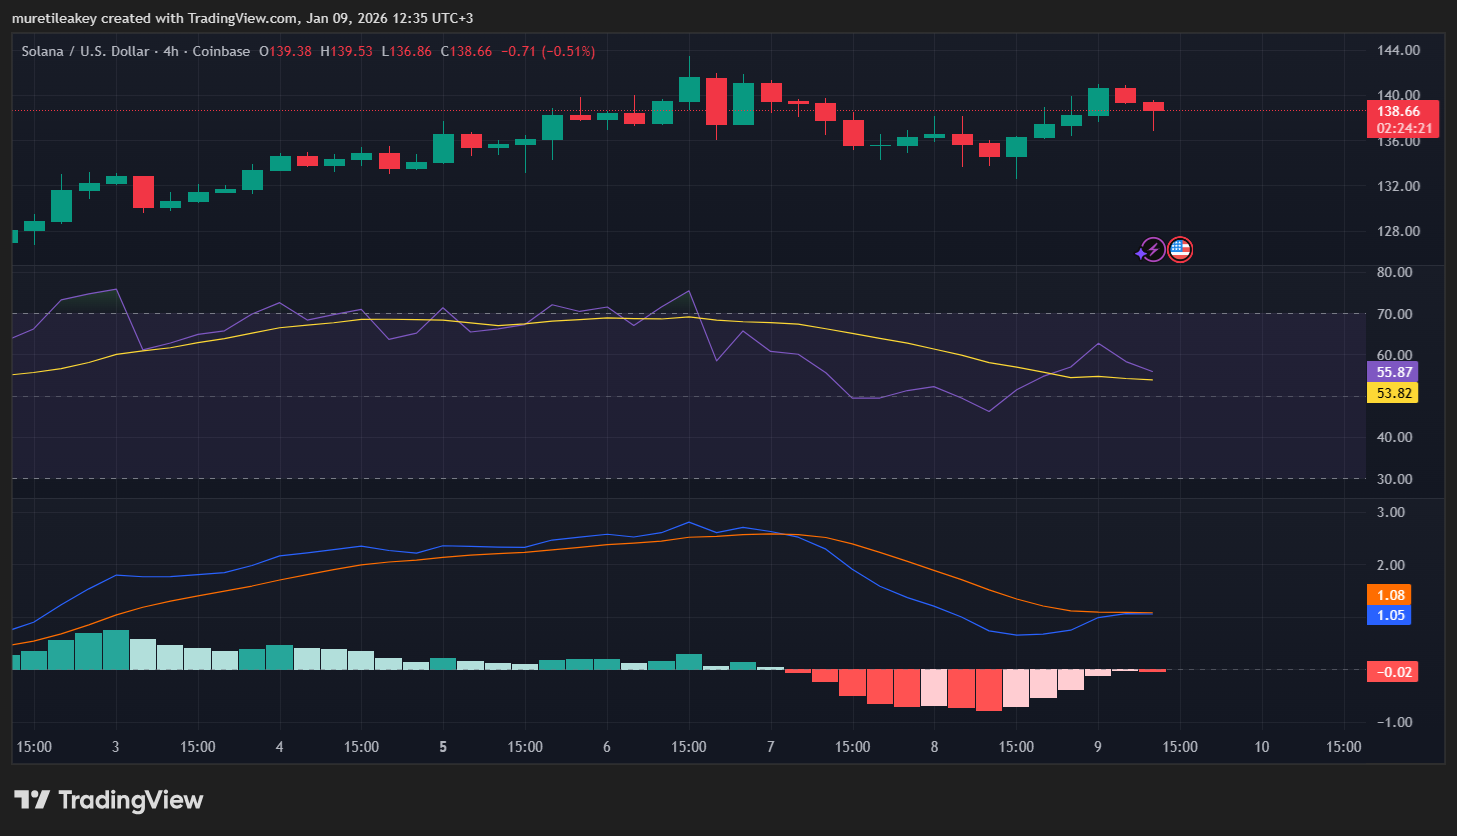 Solana consolidates below $140 as momentum cools, with trend structure remaining bullish above key support zones. (TradingView)
Open Interest and Market Structure
The comparison analysis of Solana’s price to its futures open interest indicates that the market has begun to reset itself from the high levels of leverage seen during the recent price spikes.
Throughout the price rallies in early October, open interest increased; it has cooled off more recently. This decrease in open interest suggests there is less liquidation risk.
With controlled participation, the ability for Solana to move in the long term will be more sustainable, as it shows accumulation from spot rather than excess speculation.
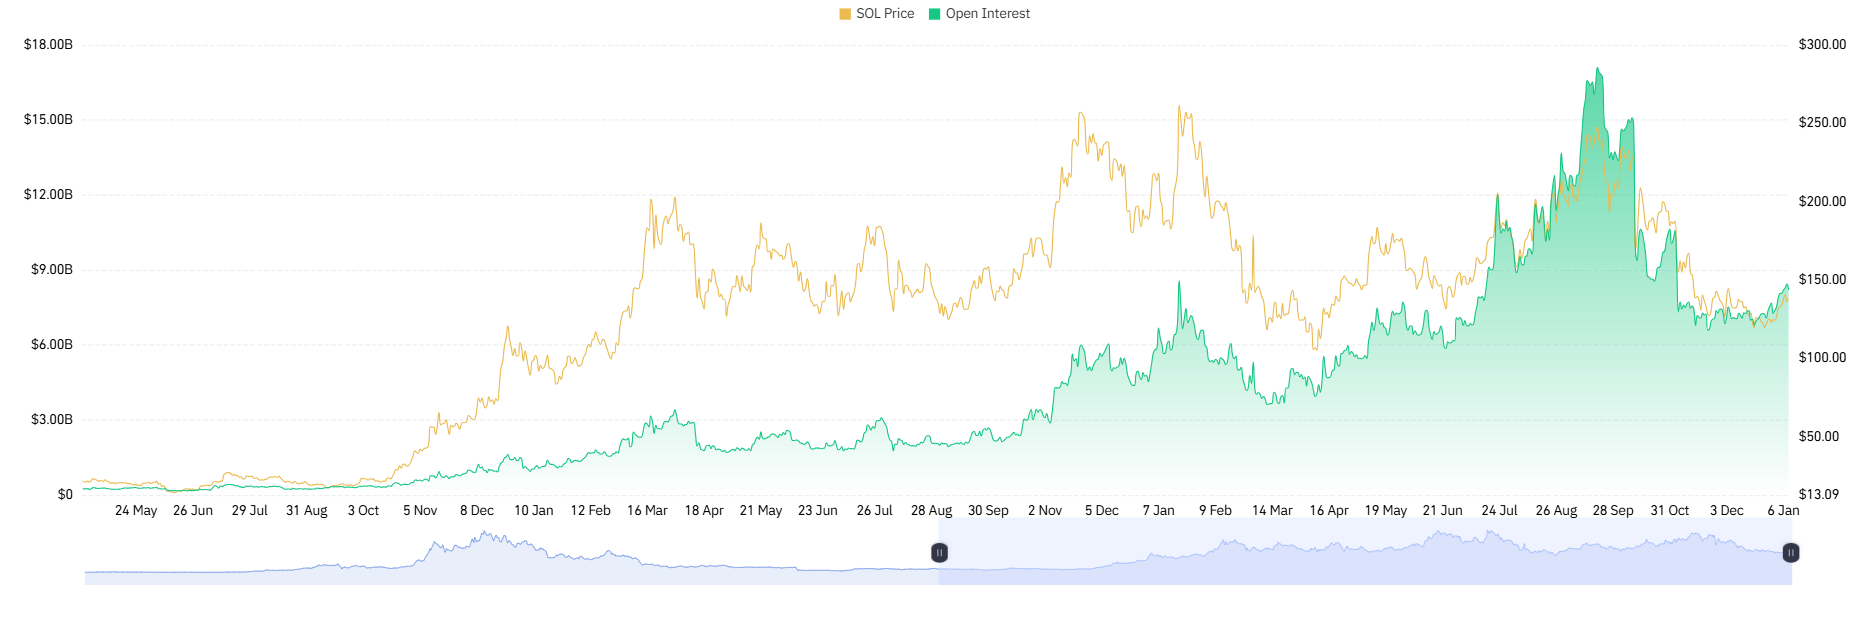 Solana price cycles alongside open interest, highlighting leverage-driven peaks, liquidation phases, and a healthier post-reset market structure. (coinglass)
If the price of Solana increases moderately and there is also a corresponding increase in open interest, it could indicate that the trend is expanding.
Conversely, if there is an unexpected increase in open interest but prices do not also rise, then this could mean the market is experiencing a period of stress.
Currently, Solana’s price appears to have levelled off, whereas the amount of open interest continues to remain around the same level as before. Therefore, there is an indication that this may provide an opportunity for a structured rally.