Key Insights
- PEPE is approaching a decisive support zone and has formed a large Head and Shoulders formation and a downward trendline influence in the overall market structure.
- PEPE’s short-term chart shows a range-bound movement around the $0.00000400 support and are signalling potential moves towards the previously tested resistance levels.
- Liquidation heatmap data reveals dense leveraged positions and liquidation clusters accumulation zones for PEPE coin upcoming major price levels.
$PEPE trades at $0.054414 today as the market reacts to steady selling pressure and rising volatility. The token shows a 3.13% drop in the past 24 hours and a 3.17% decline over the week. Traders are watching support levels closely as chart patterns and liquidation data continue to guide short-term expectations across the broader market.
Head and Shoulders Pattern Puts $PEPE at a Crossroads
A recent post from Sjuul of AltCryptoGems outlined the large Head and Shoulders structure forming on $PEPE’s three-day chart. The coin is still holding its neckline, yet it remains positioned near a potential breakdown. In the past, this level has acted as a historical buying zone, therefore, traders see it as a key pivot for upcoming movement.
On the charts, the pattern shows a clear left shoulder, head, and right shoulder. This formed a familiar bearish setup and the downward trendline added pressure as the asset continued drift over time. According to analysis if the neckline fails sellers may gain control and push the price into a deeper decline.
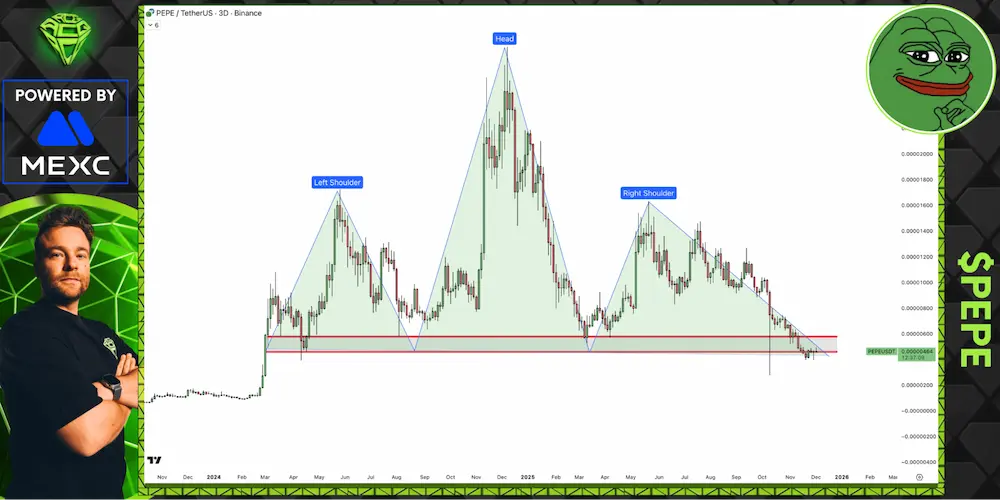 PEPEUSDT Price Charts / Source: X
Even so, a demand zone near $0.00000435 has held firm across several tests. A move upward from this zone remains possible, although a fall under $0.00000395 would cancel any emerging long-bias structure and signal stronger downward pressure.
PEPE’s Range-Bound Trading Signals a Tense Market Pause
Current price charts show $PEPE traded around $0.00000436.This is after pulling back from the $0.00000494 resistance after a W-shaped consolidation. This formation suggests that the market attempted to find footing after recent volatility. The mid-channel pivot has continually guided short-term expectations of a decisive move.
The $0.00000400 level remains a crucial support point. Holding this zone may allow the price to revisit $0.00000478–$0.00000490, an area that previously served as resistance. A drop beneath that support, however, could open a path toward further corrective movement.
Intraday performance data from CoinGecko’s chart shows a sharp early decline followed by a stretched period of sideways movement. Thereafter,a brief upward spike toward $0.0445 occurred. Despite this the market quickly returned to tight trading conditions a sign that momentum remained limited in the meantime.
PEPE’s Liquidation Map Shows Heavy Leverage and Volatile Clusters
The liquidation heatmap presented a broad view of leverage positioning across multiple price points. Dense purple zones appearing indicate an elevated liquidation risk, especially during the fast downward moves. A notable steep drop around the 05:30 timestamp coincided with rising pressure in these areas and ended up triggering forced exits across leveraged positions.
Green accumulation regions appearing on the chart, signals zones where orders continued to build. In return these pockets have offered temporary stability during sudden price shifts. Therefore this makes them important reference points as the market tests lower levels.
However, some traders have pointed to a possible double-bottom structure forming as momentum indicators improve. Therefore, if strength returns, projections include a move toward $0.0000075. If bulls reclaim this level and sustain it extended targets are near $0.0000165 if this favourable conditions persist.